
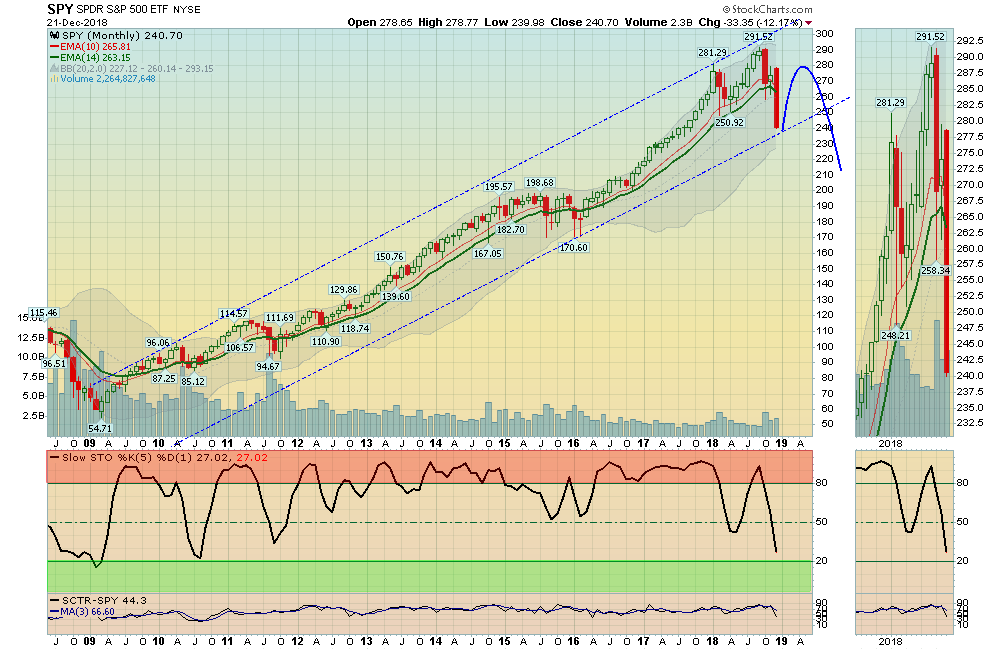
12/23/2018: Markets slipped down below the April Support this week like it was not even there. It is amazing how Investors would not Sell Way Above the Green Line in September, and are now Selling Way Below the Green Line. Eventually the Markets should bounce back up to at least the Green Line, once they bottom.
The good thing about a big Sell-Off is that we get to find out which Investments are the Strongest, The Strongest High Volume Leaders are: Pfizer PFE, Verizon VZ, Merck, MRK, Utilities Fund XLU, Coca Cola KO, Proctor & Gamble PG, Starbucks SBUX, Abbott Labs ABT, Eli Lilly LLY and many Utility Stocks.
For the week the Dow was down 6.87%, the S&P 500 was down 7.05%, and the Nasdaq 100 was down 8.32%. The very Long Term Trend on the Stock Markets is UP, but many Indices made 52-week Lows this week.
The Inflation Index (CRB) was down 4.54% and is Below the Green Line, indicating Economic Weakness.
Bonds were up 2.13% for the week and are Above the Green Line, indicating Economic Weakness.
The US DOLLAR was down 0.38%, and could be topping as the FED is probably finished Raising Rates for a while (unless they purposely want to create a Slow Down). A falling Dollar could be good for Tech Stocks and Commodities.
Crude Oil was down 10.96% for the week at $45.60, and GOLD was up slightly at $1258.
___________________________________________________________________________________________
MONEY WAVE BUYS SOON:
We are currently in 7 logged Open Positions, for the Short & Medium Term. There are 10 Investments on the Short Term Watch List.
Be patient and WAIT for Green Zone Buy Signals!
______________________________________________________________________________________________
LONG TERM TRADES
Investments below that can Bounce up off the Green Line with Above 80 Relative Strength, could re-test their recent Highs.
ARWR ARROWHEAD PHARMA. Place Buy Stop above $15.47 on the Close.
BSX BOSTON SCIENTIFIC Wait for weekly Close Above the Red Line of $35.72 (50-day avg.)
CGC CANOPY GROWTH Wait for weekly Close Above the Red Line of $34.20 (50-day avg.)
FIVE FIVE BELOW Wait for weekly Close Above the Red Line of $105.03 (50-day avg.)
FTNT FORTINET INC. Place Buy Stop above $77.18 on the Close.
I INTELSAT GLOBAL Wait for weekly Close Above the Red Line of $24.06 (50-day avg.)
LULU LULULEMON ATHLETICA Wait for weekly Close Above the Red Line of $126.83 (50-day avg.)
MSFT MICROSOFT CORP. Wait for weekly Close Above the Red Line of $105.61 (50-day avg.)
SQ SQUARE, INC. Wait for weekly Close Above the Red Line of $66.48 (50-day avg.)
WWE WORLD WRESTLING Place Buy Stop above $77.95 on the Close.
___________________________________________________________________________________________
Click for Portfolio (Open Positions)
Click for Watch List
Click for Closed Positions
Alert! Market Risk is LOW (Green Zone). The probability of successful Short Term Trades is better, when the S&P 500 is down near the Green Line.
Tell your Friends about the Green Line, and Help Animals.
QUESTION: PGP writes” What are your recommendations for your 401k clients?”
ANSWER: The easy answer is to only OWN Investments that are Above the Green Line. Historically, there should always be many choices available.
But if your 401k Plan does not have Sector Funds or Stocks, you might not have many Options.
Buy & Hold could be difficult for the next year or so, if you only have the basic Stocks, Bonds Int’l. & Cash Funds as your choices.
One Solution could be to use Market Timing (see Chart Link below) with the S&P 500 Fund while the FED is tightening. Buy Green Zone, Sell Red Zone.


