
12/19/2021 Markets were lower for the week, on Fears of the Virus picking back up, and on the FED Tapering news. We should find out soon if the Markets can hold up without the FED propping it up as much as they did earlier this year. Currently the S&P 500 Index is over-bought (Way Above the Green Line), but the Small Cap Index is down on the Green Line. Money has not been leaving the Markets, but rotating around into the various Sectors. So after the End of the Year Tax Loss Selling on the Small Caps ends in nine days, maybe the Money will rotate back into the Small Caps again.
The Long Term Treasury Bond prices have held up well. even with tremendous Inflation news being reported. Maybe stronger Bonds are telling us that the Economy could be slowing down, and Commodity Prices have stalled out also. Interest Rates are stable so Stock and Bond Investments are still the only place for the Herd to have their Money. Eventually that will change, and the Green Line System will be there to help you “Follow the Money”.
If you continue to Follow the Green Line System, your Money should flow into the Strongest areas and your account value should be able to grow in both Bull and Bear Markets.
There has been plenty of action on the Day Trading Scrolling Charts.
NEW! DAY TRADING CHARTS FOR INDICES & LARGE CAPS.
We have not had many intra-day Stocks Alerts lately as the Volume has been too Low on Buy Signals. We like High Volume on rallies.
For the week the Dow was down 1.65%, the S&P 500 was down 1.97%, and the NASDAQ 100 was down 3.29%. The Long Term Trend for the Indices is up.
The Inflation Index (CRB) was down 0.34% for the week and is Above the Green Line, indicating Economic Expansion.
Bonds were up 1.44% for the week, but are back Above the Green Line, indicating Economic Contraction.
The US DOLLAR was up 0.47% for the week and is Above the Green Line.
Crude Oil was down 1.33% for the week at $70.72, and GOLD was up 1.13% at $1804.90.
_____________________________________________________________________________________________
MONEY WAVE BUYS SOON
We are currently in 3 logged Current Positions, for the Short & Medium Term. There are 6 investments on the Short Term Watch List.
Be patient and WAIT for Green Zone Buy Signals!
_________________________________________________________________________________________
LONG TERM INVESTMENTS (many Large Caps no longer have 80 Relative Strength required.)
Long Term Scrolling Charts (Real Time)
BCRX BIOCRYST PHARMA. Shot up 11.85% this week. Buy if it Closes above $13.27 with High Volume.
BTU PEABODY ENERY CORP. Shot up 8.76% this week. Buy if it Closes above $12.17 with High Volume.
COF CAPITAL ONE FINANCIAL Wait for the next Daily Money Wave Buy Signal with High Volume.
DBC COMMODITY FUND Buy if it Closes above the Red Line (50-day avg.) with High Volume.
ERJ EMBRAER AIRCRAFT Buy if it Closes above $15.73 with High Volume.
M MACY’S INC. Buy if it Closes above the Red Line (50-day avg.) with High Volume.
RRC RANGE RESOURCES CORP. Buy if it Closes above $19.44 with High Volume.
RSX RUSSIA FUND Buy if it Closes above the Red Line (50-day avg.) with High Volume.
UPST UPSTART HOLDINGS Buy if it Closes above the Pink Line (10-day avg.) with High Volume.
______________________________________________________________________________________
My Trading Dashboard
Swing Trading Scrolling Charts
Day Trading Scrolling Charts
Click for Watch Lists
Click for Current Positions
Click for Closed Positions
Updated Top 100 List Dec 1, 2021
Dividend Growth Portfolio
ETF Sector Rotation System
Dogs of the DOW System
Long Term Strategy for IRAs & 401k Plans
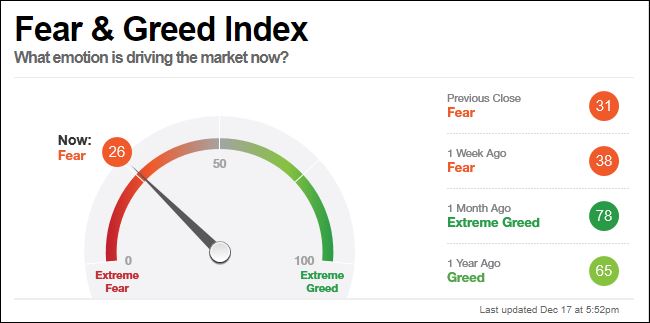
CNN Fear & Greed Index
Scrolling Stage Chart Investing Charts
Alert! Market Risk is MEDIUM (Yellow Zone). The probability of successful Short Term Trades is better, when the % of stocks above the 50-day avg. is below 20.
Tell your Friends about the Green Line, and Help Animals.
______________________________________________________________________________________
QUESTION: John C. writes “Hi. I have been using your methods with quite good success over the past year, but lately I have been wondering something. Sometimes you post a daily chart for a company, but other times you post a weekly chart. For swing/momentum trading, which chart is best to go by, because looking at both, side to side, the Money Waves are quite different.
Many thanks, John C.
ANSWER: Hi John. The Green Line System is based on Buying the Leaders in the Green Zone, and taking Profits in the Red Zone.
The Daily Chart cycle (Green Zone to Red Zone) usually takes 1-3 weeks and the Weekly Chart takes 1-3 months. If you Buy the Weekly, don’t look at the Daily, as the Daily will cycle thru many times and be confusing. Pick only one Time Frame, and stick with it.
Many will use a shorter term Time Frame for ENTRY only, then go back to your Main Chart decision.
Thanks for writing.
ATGL
