
12/12/2021 Markets were up sharply for the week, as the major Indices were very over-sold for the Short Term. The S&P 500 Index is quickly back up near the Highs, but the weaker DOW 30, NYSE, and Small Cap Indices are lagging behind. Many are concerned about the FED beginning the Tapering of their massive Debt Buying. We should find out soon if there will be enough Buyers to push the Markets higher without help from the FED’s Printing.
The Long Term Treasury Bond prices have moved up recently, telling us that the Economy could be slowing down. This happened to Bonds in 2018 but the FED continued to tighten (the FED does not seem to follow Long Bond prices). The FED almost caused a big slowdown, but they finally realized their mistake and began Printing again in 2019.
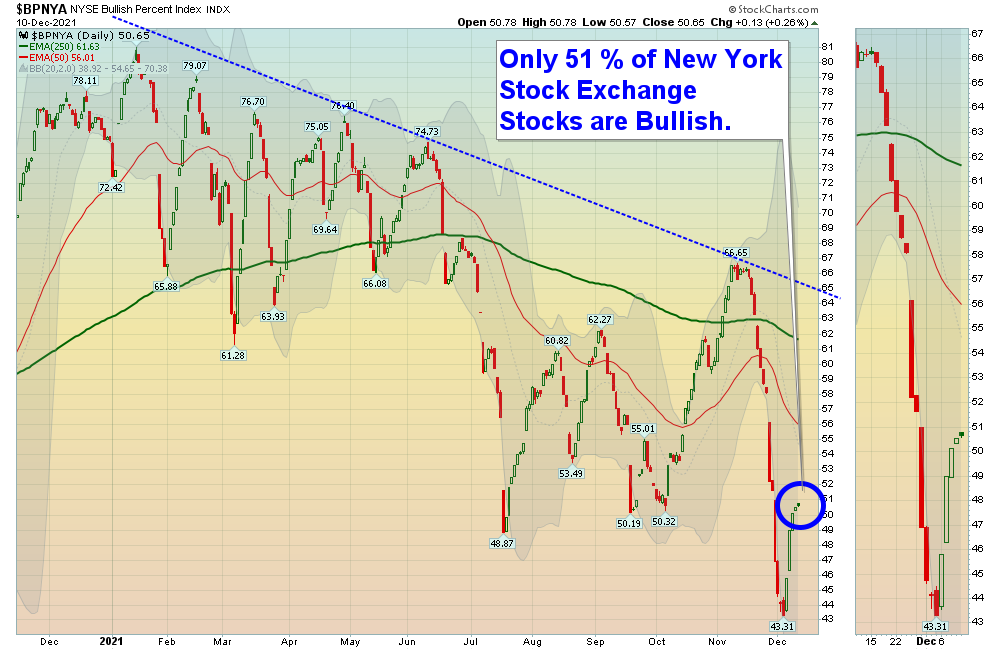
But now the FED has become more political because of the high Inflation numbers that we have now. Some polls show that Americans are now more concerned about Inflation than COVID (not good for re-election). The FED is being pressured to get rid of Inflation, even though the GDP has quickly dropped from 6.7% to only 2.1% in the last 2 quarters. Don’t be surprised if the FED begins aggressive tightening, causes a slowdown, but then is reluctant to Print again because of Inflation Fears. Maybe that is why only 51% of the 2300 NYSE Stocks (see Chart above) are Bullish (1127 stocks are Bearish).
If you continue to Follow the Green Line System, your Money should flow into the Strongest areas and your account value should be able to grow in both Bull and Bear Markets.
There has been more action on the Day Trading Scrolling Charts.
NEW! DAY TRADING CHARTS FOR INDICES & LARGE CAPS.
We have not had many intra-day Stocks Alerts lately as the Volume has been too Low on Buy Signals. We like High Volume on rallies.
For the week the Dow was up 4.04%, the S&P 500 was up 3.82%, and the NASDAQ 100 was up 3.88%. The Long Term Trend for the Indices is up.
The Inflation Index (CRB) was up 2.39% for the week and is Above the Green Line, indicating Economic Expansion.
Bonds were down 3.56% for the week, but are back Above the Green Line, indicating Economic Contraction.
The US DOLLAR was down 0.01% for the week and is Above the Green Line.
Crude Oil was up 8.16% for the week at $71.67 and GOLD was up 0.05% at $1784.80.
_____________________________________________________________________________________________
MONEY WAVE BUYS SOON
We are currently in 8 logged Current Positions, for the Short & Medium Term. There are 2 investments on the Short Term Watch List.
Be patient and WAIT for Green Zone Buy Signals!
_________________________________________________________________________________________
LONG TERM INVESTMENTS (many Large Caps no longer have 80 Relative Strength required.)
Long Term Scrolling Charts (Real Time)
BCRX BIOCRYST PHARMA. Buy if it Closes above $13.27 with High Volume.
BTU PEABODY ENERY CORP. Buy if it Closes above $12.17 with High Volume.
COF CAPITAL ONE FINANCIAL Wait for the next Daily Money Wave Buy Signal with High Volume.
DBC COMMODITY FUND Wait for the next Daily Money Wave Buy Signal with High Volume.
ERJ EMBRAER AIRCRAFT Shot up 13 % this week. Wait for the next Daily Money Wave Buy Signal with High Volume.
RRC RANGE RESOURCES CORP. Wait for the next Daily Money Wave Buy Signal with High Volume.
RSX RUSSIA FUND Wait for the next Daily Money Wave Buy Signal with High Volume.
UPST UPSTART HOLDINGS Wait for the next Daily Money Wave Buy Signal with High Volume.
______________________________________________________________________________________
My Trading Dashboard
Swing Trading Scrolling Charts
Day Trading Scrolling Charts
Click for Watch Lists
Click for Current Positions
Click for Closed Positions
Updated Top 100 List Dec 1, 2021
Dividend Growth Portfolio
ETF Sector Rotation System
Dogs of the DOW System
Long Term Strategy for IRAs & 401k Plans
CNN Fear & Greed Index
Scrolling Stage Chart Investing Charts
Alert! Market Risk is MEDIUM (Yellow Zone). The probability of successful Short Term Trades is better, when the % of stocks above the 50-day avg. is below 20.
Tell your Friends about the Green Line, and Help Animals.
______________________________________________________________________________________
QUESTION: Jose M writes “Morning, I seem to have difficulties on finding the Money Wave chart on the ETFs. Thanks.”
ANSWER: First go to MY TRADING DASH BOARD. Then the Charts with the Money Waves can be pulled up by clicking on the Symbol of the Investment on the Watch List or Current Positions links in every Daily email.
The Money Wave is the Red and Green Zone on the bottom part of the Chart. Buy when the Money Wave has gone down into the Green Zone, and then turns up above 20.


