
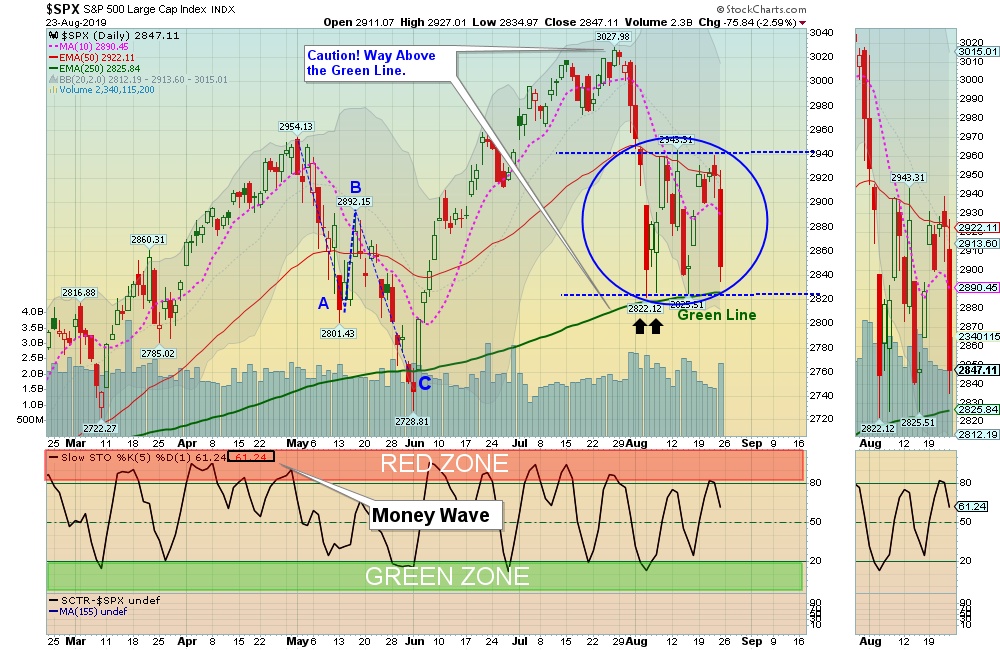
08/25/2019: Markets were down for the week, after failing to Close above the Red Line (50-day avg.) The S&P 500 Index is boxed between the Green Line (250-day avg.) and the Red Line (50-day avg.). A BIG move should occur when the Index breaks above or below one of these averages.
The 2 FEAR Trades (Bonds and Gold) are very extended and look like they could finally start correcting back down to their Green Lines. FEAR is a temporary human emotion and does not last that long, so this could be Bullish for Stocks if the FEAR subsides. (A Trade Deal coming?)
For our members that are worried about a continued Trade War, let’s Follow the Money and the Green Line Rules. The Small Cap Index is Below the Green Line + 30 Relative Strength. The INVERSE Small Cap Fund has just popped up in the filter and is Above the Green Line + 80 Relative Strength required by the Rules for major Indices. This CHART compares the 2 Funds, and if the Markets do turn Bearish later this year, we will Follow the Money and roll into Inverse Funds. Inverse Funds can do very well in declining Markets, but it is too early for most.
For the week the Dow was down 1.00%, the S&P 500 was down 1.38%, and the Nasdaq 100 was down 1.84%. The Long Term Trend on the Stock Markets is UP.
The Inflation Index (CRB) was down 1.05% and is Below the Green Line, indicating Economic Weakness.
Bonds were down 0.12% for the week and are Way Above the Green Line, indicating Economic Weakness.
The US DOLLAR was down 0.53%, but it could be having a huge Double Top from 3 years ago.
Crude Oil was down 1.17% for the week at $54.17, and GOLD was up another 0.92% to a New High at $1537.60.
___________________________________________________________________________________________
MONEY WAVE BUYS SOON:
We are currently in 3 logged Open Positions, for the Short & Medium Term. There are 4 Investments on the Short Term Watch List.
Be patient and WAIT for Green Zone Buy Signals!
______________________________________________________________________________________________
LONG TERM INVESTMENTS
Buy the Leading Investments that are down near the weekly Green Zones.
EVRI EVERI HOLDINGS Buy if it is going to Close above $9.79.
KTOS KRATOS DEFENSE Wait for next Daily Green Zone Buy.
PYPL PAYPAL HOLDINGS Wait for next Daily Green Zone Buy.
SBGI SINCLAIR BROADCAST GROUP Wait for next Daily Green Zone Buy.
XRX XEROX CORP. Buy when it Closed back Above the Green Line.
ZEN ZENDESK INC. Buy if it is going to Close above $78.87.
ZNGA ZYNGA INC. Wait for next Daily Green Zone Buy.
___________________________________________________________________________________________
Click for Portfolio (Open Positions)
Click for Watch List
Click for Closed Positions
Alert! Market Risk is MEDIUM (Yell0w Zone). The probability of successful Short Term Trades is better, when the % of stocks above the 50-day avg. is below 20.
Tell your Friends about the Green Line, and Help Animals
___________________________________________________________________________________________
QUESTION: Will N. writes “Can I do a search on GL to find the relative strength of any stock or ETF? Thank you.”
ANSWER: Hi Will, and thank you for writing. If you do not have a StockCharts subscription, you can follow the Green Line lists at StockCharts HERE & HERE.
Maybe bookmark these pages.
You should be able to access StockChart’s Relative Strength Indicator (SCTR) HERE.
Good trading, and tell your friends!
AGL


