Above The Green Line

  • Commentary
    • BUY / SELL SIGNALS
      • Stock Alerts
    • DIVGRO BLOG
    • ETF SECTOR BLOG
    • DOW DOGS BLOG
    • NEWS
    • STOCK IDEAS
  • Strategies
    • SWING TRADING
      • CURRENT POSITIONS
      • WATCHLISTS
      • CLOSED POSITIONS
      • CANDIDATES – TOP 100
      • SPECIALTY STOCKS
    • DAY TRADING
      • Watch List
    • DIVIDEND GROWTH
      • Dividend Growth Portfolio
      • Dividend Calendar
    • DOGS OF THE DOW
      • Dogs of the Dow Portfolio
      • DOW 5 Portfolio
    • ETF SECTOR ROTATION
      • ETF Sector Portfolio
  • Markets
    • US MARKET
      • Commodities
      • Energy
      • Precious Metals
      • Volatility
    • GLOBAL MARKETS
      • MARKET INDICES
      • ECONOMIC CALENDAR
      • FOREX HEAT MAP
      • FOREX CROSS RATES
      • CRYPTOCURRENCY MARKET
    • DASHBOARD
    • IDEAS
  • Investing
    • FORUM
  • Resources
    • ARTICLES
    • WEEKLY STOCK
    • RETIREMENT PLANNING
    • BLOGROLL
    • FAQ
  • About
    • CONTACT US
    • HOW TO WIN
    • #1 AT STOCKCHARTS
  • Log In
  • Subscribe

August 18, 2019

Green Line Weekly Aug 18, 2019

SP
S&P 500 Index needs to do a “W” pattern back up to remain Bullish.


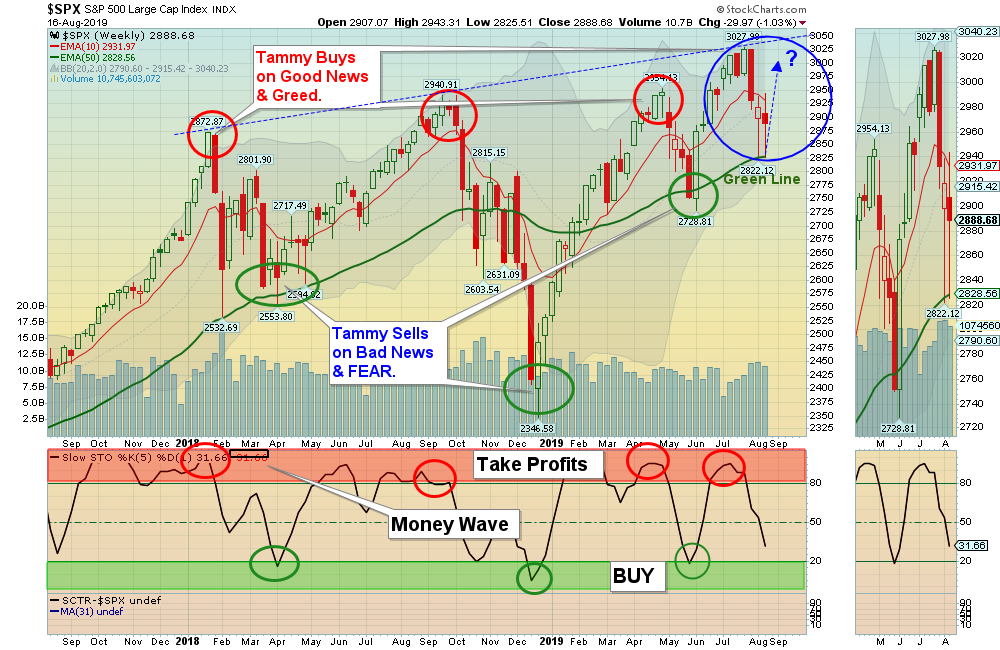
08/18/2019:  Markets were down slightly for the week, after bouncing up again from the Green Line. Last week the S&P 500 Index bounced up from the Green Line, but then Failed decisively up at the 50-day average. This week’s bounce should be a “W” pattern back up near the Highs to remain Bullish.

That means that Trump needs to cut a Trade Deal with China soon to avoid Stocks from giving up… The NYSE and Small Cap Indices are Below the Green Line.

For the week the Dow was down 1.63%, the S&P 500 was down 0.95%, and the Nasdaq 100 was down 0.54%.  The Long Term Trend on the Stock Markets is UP. 


The Inflation Index (CRB) was down 0.98% and is Below the Green Line, indicating Economic Weakness.

Bonds  were up 4.34% for the week to a New High and are Way Above the Green Line, indicating Economic Weakness.

The US DOLLAR was up 0.76%, but it could be having a huge Double Top from 3 years ago. 

Crude Oil was up 0.57% for the week at $54.81, and GOLD was up another 1.00%  to a New High at $1523.60.

___________________________________________________________________________________________

COMPLETED TRADES THIS WEEK:    


2019-08-08  CPRT    Copart  Inc.      $75.65    2019-08-14   $74.31    -$1.34     -1.77%


MONEY WAVE BUYS SOON:   

We are currently in 5 logged Open Positions, for the Short & Medium Term.  There are 4 Investments on the Short Term Watch List. 

Be patient and WAIT for Green Zone Buy Signals!

______________________________________________________________________________________________

LONG TERM INVESTMENTS 

Buy the Leading Investments that are down near the weekly Green Zones.  

EVRI     EVERI HOLDINGS    Buy if it is going to Close above $9.79.     

KTOS     KRATOS DEFENSE    Wait for next Daily Green Zone Buy.

PYPL     PAYPAL HOLDINGS      Wait for next Daily Green Zone Buy.

SBGI     SINCLAIR BROADCAST GROUP    Wait for next Daily Green Zone Buy.

XRX     XEROX CORP.     Buy when it Closed back Above the Green Line.

ZEN     ZENDESK INC.    Buy if it is going to Close above $78.87.     

___________________________________________________________________________________________

Click for  Portfolio (Open Positions)  
Click for  Watch List
Click for  Closed Positions


Alert! Market Risk is MEDIUM (Yell0w Zone). The probability of successful Short Term Trades is better, when the % of stocks above the 50-day avg. is below 20. 

Tell your Friends about the Green Line, and Help Animals

___________________________________________________________________________________________

A Letter to Sarah:

Hi Sarah. Above the Green Line is a System of rotating into Investments that generally have more Buyers than Sellers (Above the Green Line = > 250 day average), and the highest Relative Strength (> 90 RS).

This System is designed to Buy High, and Sell Higher, Momentum Investing that requires the discipline to EXIT Investment position that are no longer the LEADERS, or follow the RULES.

Many are taught to Buy Low and Sell High, which can work well, but sometimes you must wait years for results.

We are basically using computers to identify the top 10% of Investments that have the highest flow of money into them. Then we Buy these on pull-backs to their Green Zones, based on the Money Wave.

Good trading, and tell your friends!

Posted By AbovetheGreenLine at 1:20 pm 6 Comments Tagged With: premium

Comments

  1. Cees says

    August 18, 2019 at 2:50 pm

    Where is your green line? Here in the SPX it is at 50 EMA. In other charts it is 250 EMA.
    You said it failed at 50, but in the chart it failed at 10 EMA.
    Confusing or misleading?

    Log in to Reply
    • AbovetheGreenLine says

      August 18, 2019 at 3:30 pm

      Hi Cees. The Green Line is the 250 day exponential moving average on the Daily Charts.

      You can check on this Chart HERE

      Log in to Reply
  2. Cees says

    August 18, 2019 at 3:35 pm

    So, why is it different in your Aug 18 SPX chart?

    Log in to Reply
    • AbovetheGreenLine says

      August 18, 2019 at 3:40 pm

      The Aug 18th Chart is a Weekly Chart, so the Green Line is converted from 250 days to 50 weeks…

      Log in to Reply
  3. Cees says

    August 18, 2019 at 3:50 pm

    If I understand right, you put a weekly chart up, but you give comment on the daily chart.
    That is where the confusion is.

    Log in to Reply
    • AbovetheGreenLine says

      August 18, 2019 at 3:57 pm

      Yes. Sorry for the confusion… I should have also put that is Failed at the Red Line (10-week & 50-day).

      Thanks.

      Log in to Reply

Leave a Reply Cancel reply

You must be logged in to post a comment.

Voted #1 at Stock Charts

SH Chart
Inverse S&P 500 Fund (SH) will have a Money Wave Buy today.

Help Us Help Animals

Help Us Help Animals

Recent Comments

  • Green Line Weekly! Aug 7, 2022 – ParkRiver on Green Line Weekly! Aug 7, 2022
  • AbovetheGreenLine on Money Wave Alert! Aug 5, 2022
  • merryme on Money Wave Alert! Aug 5, 2022
  • AbovetheGreenLine on Target was Hit on CTIC for an 8.9% Gain.
  • SlippinJimmy on Target was Hit on CTIC for an 8.9% Gain.

Become a Green Liner!

Help me make more Money in the Stock Market.

Above the Green Line

ON ATGL

  • Weekly Commentary
  • Intraday Buy / Sells
  • Day Trade Setup

STRATEGIES

  • Swing Trading
  • Dividend Growth
  • ETF Sector Rotation
  • Dogs of the Dow

HELP

  • ATGL Trading Rules
  • FAQ
  • Account Maintenance
  • Contact US

© Copyright 2021 · AboveTheGreenLine.com · All Rights Reserved · Privacy · Terms · Contact · WatchList · Current