
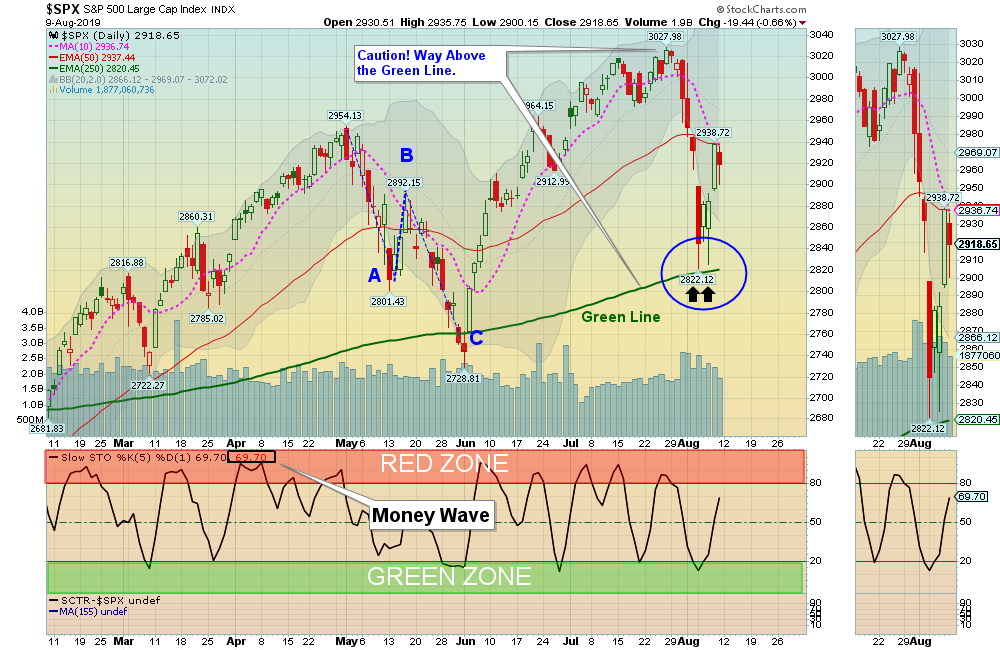
08/11/2019: Markets were down slightly for the week, after dumping down to the Green Line and then bouncing nicely.
Bonds and Gold are trading as if an Economic Slow Down is a certainty. Trump needs to cut a Trade Deal with China soon to avoid Stocks from giving up… With Elections on the horizon, will Trump change his negotiation bluff and cut any kind of Trade Deal? Very possible.
Most of the major Indices and Leaders bounced well since Tuesday, but could dip down again next week to test the Green Line again.
For the week the Dow was down 0.62%, the S&P 500 was down 0.34%, and the Nasdaq 100 was down 0.46%. The Long Term Trend on the Stock Markets is UP.
The Inflation Index (CRB) was down 0.73% and is Below the Green Line, indicating Economic Weakness.
Bonds were up 2.59% for the week to a New High and are Way Above the Green Line, indicating Economic Weakness.
The US DOLLAR was down 0.45% to a New High, but it could be having a huge Double Top from 3 years ago.
Crude Oil was down 2.08% for the week at $54.50, and GOLD was up another 3.50% to a New High at $1508.50.
___________________________________________________________________________________________
COMPLETED TRADES THIS WEEK:
2019-08-05 ROKU ROKU Inc. $102.57 2019-08-08 $122.03 $19.46 18.97%
2019-08-06 DIS Walt Disney Co. $141.87 2019-08-07 $134.86 -$7.01 -4.94%
2019-07-19 GBTC Grayscale Bitcoin $13.23 2019-08-05 $14.60 $1.37 10.36%
MONEY WAVE BUYS SOON:
We are currently in 5 logged Open Positions, for the Short & Medium Term. There are 5 Investments on the Short Term Watch List.
Be patient and WAIT for Green Zone Buy Signals!
______________________________________________________________________________________________
LONG TERM INVESTMENTS
Buy the Leading Investments that are down near the weekly Green Zones.
CSCO CISCO SYSTEMS Wait for next Daily Green Zone Buy.
EVRI EVERI HOLDINGS Wait for next Daily Green Zone Buy.
PYPL PAYPAL HOLDINGS Wait for next Daily Green Zone Buy.
SBGI SINCLAIR BROADCAST GROUP Wait for next Daily Green Zone Buy.
XRX XEROX CORP. Wait for next Daily Green Zone Buy.
___________________________________________________________________________________________
Click for Portfolio (Open Positions)
Click for Watch List
Click for Closed Positions
Alert! Market Risk is MEDIUM (Yell0w Zone). The probability of successful Short Term Trades is better, when the % of stocks above the 50-day avg. is below 20.
Tell your Friends about the Green Line, and Help Animals
___________________________________________________________________________________________
QUESTION: Jose M writes “Morning, I seem to have difficulties on finding the Money Wave chart on the etfs thanks.”
ANSWER: The Charts and Money Waves can be pulled up by clicking on the Symbol of the Investment on the Watch List or PORTFOLIO links in every Daily email.
The Money Wave is the Red and Green Zone on the bottom part of the Chart. Buy when the Money Wave has gone down into the Green Zone, and then turns up above 20. (See Chart below, and Black Arrow indicates a Buy Signal).


