
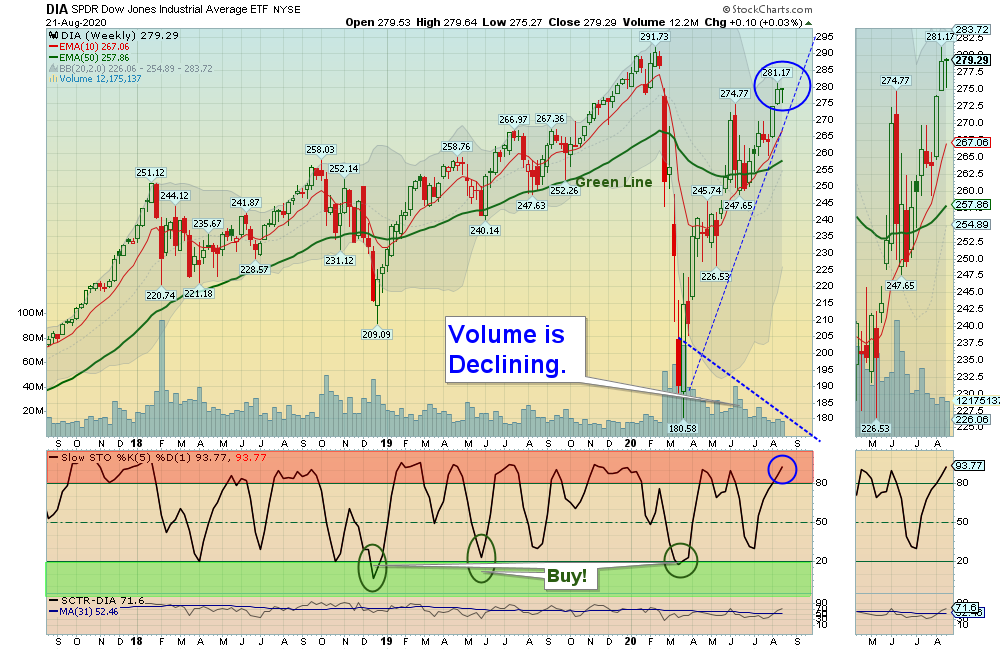
08/23/2020 Markets were mostly up for the week as the S&P 500 Index is back up to the Feb. High. The NASDAQ 100 Index made another New High, but the broad New York Index and the Small Caps were down this week. There should be plenty of Sellers up around the Feb Highs (Resistance), so a pullback down to the 50-day average or below could create a “Cup & Handle” Pattern back up.
Three of the largest Stocks: Apple Inc. (+8.23%), NVIDIA Corp. (+ 9.68%), % Tesla Inc. (+ 24.19%) appear to be having Buying Climaxes, as the three picked up about $275 Billion of Market Cap in 1 week! These 3 stocks are acting very similar to the big NASDAQ Stocks at the Top of the Internet Bubble in 1999 (where Cisco, Dell, Lucent, Microsoft & Sun Micro had their final blow out).
It would be healthier for the Indices to pull- back 5% or more, and they will after the emotional Investors spend all of their Cash by buying Way Above the Green Lines. We like to Buy Investments that have recently made New Highs, on pullbacks. These are NASDAQ 100 (QQQ), Semiconductor Fund (SMH), Home Building Fund (XHB), Internet Fund (FDN) & Retail Fund (XRT), but they are currently over bought (so we wait for pullbacks). Gold Miners (GDX), Gold Fund (IAU), and Silver Fund (SLV) are pulling back now.
The PENNY STOCK WATCH LIST has many Green Zones Buy Signals soon that are 50-80% off the recent Highs. The Pajama Boy Buyers seem to have temporarily run out of Stimulus Money.
For the week the Dow was unchanged, the S&P 500 was up 0.78%, and the Nasdaq 100 was up 3.57%. The Long Term Trend for the Indices is up.
The Inflation Index (CRB) was up 0.50% and is Below the Green Line, indicating Economic Weakness.
Bonds were 1.85% for the week and are Above the Green Line, indicating Economic Weakness.
The US DOLLAR was unchanged for the week and is Below the Green Line.
Crude Oil was up 0.79% for the week at $42.34 and GOLD was down 0.14% at $1947.00.
_____________________________________________________________________________________________
MONEY WAVE BUYS SOON
We are currently in 2 logged Current Positions, for the Short & Medium Term. There are 12 Investments on the Short Term Watch List.
Be patient and WAIT for Green Zone Buy Signals!
______________________________________________________________________________________________
LONG TERM INVESTMENTS (Most of the Leaders are back up in the Weekly Red Zones.)
Buy the Leading Investments that are down near the Weekly Green Zones.
AUY YAMANA GOLD Wait for Money Wave Buy Signal soon. All time High is $18.50.
FCEL FUELCELL ENERGY INC. Buy if it Closes above $3.42 on High Volume. All time High is $682.00.
GPRO GOPRO INC. Buy if it Clo ses above $5.79 on High Volume. All time High is $98.00.
KIRK KIRKLAND’S INC. Missed it… Popped up 59 % this week! All time High is $29.50.
NK NANTKWEST INC. Wait for a Close above the Pink Line. All time High is $35.00.
RIOT RIOT BLOCKCHAIN INC. Wait for the next Daily Money Wave Buy. All time High is $46.20.
______________________________________________________________________________________
Click for Current Positions
Click for Watch List
Click for Closed Positions
Dividend Growth Portfolio (we are now posting a Dividend Calendar for the entire portfolio to assist with planning purposes).
ETF Sector Rotation System – New Quarterly Rotation was on June 30 & July 1, 2020.
Long Term Strategy for IRAs & 401k Plans
Alert! Market Risk is HIGH (Red Zone). The probability of successful Short Term Trades is better, when the % of stocks above the 50-day avg. is below 20.
Tell your Friends about the Green Line, and Help Animals
___________________________________________________________________________________________
QUESTION: Omar writes: “Hello guys. I am new to your website and want to know where I can get analysis for a special stock or commodity?”
ANSWER: HI Omar. Here is a link to Chart your existing investment positions: https://abovethegreenline.com/chart/
Here is another video for using Daily emails: https://youtu.be/v_Uy6jh2r24
And the Rules.
Good trading and tell your friends!
AGL
