
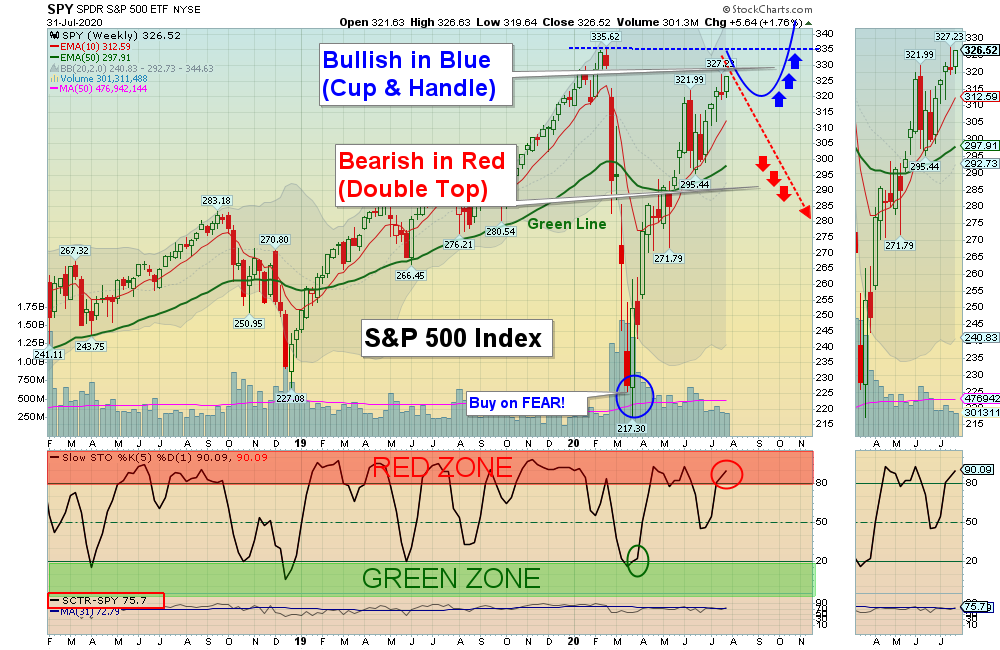
08/02/2020 Markets were mostly up for the week as the S&P 500 Index is getting up close to the All Time Highs in Feb. There would normally be plenty of Sellers at the Feb Highs (Resistance), so a pullback down to the 50-day average or below could create a “Cup & Handle” Pattern (see blue lines in Chart above for Bullish scenario). Or the Markets could be forming a massive “Double Top” of the 11 year Bull Market (Bearish). We will have to wait and see.
We like to Buy Investments that have recently made New Highs, on pullbacks. These are NASDAQ 100 (QQQ), Semiconductor Fund (SMH), BioTech Fund (XBI), Gold Fund (IAU) and Silver Fund (SLV) but they are currently over bought (so we wait for pullbacks). The DOW 30 Fund (DIA), S&P 500 (SPY), Small Caps (IWM), Transports Fund (IYT) and World Fund (VT) are lower than in Feb. and are currently inferior.
The CNN Fear & Greed Index is back up to 65. With Interest Rates near zero, Inflation could be starting up as Silver & Gold both made New Highs again this week, and Copper is close to breaking out. Agriculture and Oil are still very weak. Silver & Gold Funds are both in the ETF Sector Rotation System.
The Watch List has grown with Leaders as they return to the Green Zones for Money Wave Buy Signals. Several of the recent “Story Stocks” have pulled back down 30-50% as Tammy bought on Good News, and she is now getting Flushed Out. NEW PENNY STOCK WATCH LIST
For the week the Dow was down 0.13%, the S&P 500 was up 1.76%, and the Nasdaq 100 was up 4.00%. The Long Term Trend for the Indices is up.
The Inflation Index (CRB) was up 0.45% and is Below the Green Line, indicating Economic Weakness.
Bonds were up 0.74% for the week and are Above the Green Line, indicating Economic Weakness.
The US DOLLAR was down o.86% for the week and is Below the Green Line.
Crude Oil was down 2.47% for the week at $40.27 and GOLD was up 4.66% at $1985.90, a New High.
_____________________________________________________________________________________________
MONEY WAVE BUYS SOON
We are currently in 4 logged Current Positions, for the Short & Medium Term. There are 11 Investments on the Short Term Watch List.
Be patient and WAIT for Green Zone Buy Signals!
______________________________________________________________________________________________
LONG TERM INVESTMENTS (Most of the Leaders are back up in the Weekly Red Zones.)
Buy the Leading Investments that are down near the Weekly Green Zones.
AUY YAMANA GOLD Wait for the next Daily Money Wave Buy. All time High is $18.50.
FCEL FUELCELL ENERGY INC. Buy if it Closes above $3.42 on High Volume. All time High s $682.00.
GPRO GOPRO INC. Buy if it Closes above $5.79 on High Volume. All time High s $98.00.
KIRK KIRKLAND’S INC. Wait for the next Daily Money Wave Buy. All time High s $29.50.
RRC RANGE RESOURCES CORP. Buy if it Closes above $7.14 on High Volume. All time High is $92.45.
______________________________________________________________________________________
Click for Current Positions
Click for Watch List
Click for Closed Positions
Dividend Growth Portfolio (we are now posting a Dividend Calendar for the entire portfolio to assist with planning purposes).
ETF Sector Rotation System – New Quarterly Rotation was on June 30 & July 1, 2020.
Long Term Strategy for IRAs & 401k Plans
Alert! Market Risk is MEDIUM (Yellow Zone). The probability of successful Short Term Trades is better, when the % of stocks above the 50-day avg. is below 20.
Tell your Friends about the Green Line, and Help Animals
___________________________________________________________________________________________
4 Ways to Get your Daily Money Wave Alert:
- Emailed to your box between 3:30 3:50pm EST.
- Website menu Commentary/Buy/Sell Signals
- Twitter notifications are the fastest @AboveGreenLine
- Text messages: Email us your Cell number & phone carrier.
Thank you,
AGL


