
4/24/2022 Markets were lower for the week as many are worried about high Interest Rates and Inflation. Tammy is dumping stocks as if a slow down is coming, but the high Put / Call ratio (FEAR) says that it is almost too late to Sell. The major Indices are over-sold and most of the strongest Leaders are back down to the Green Zones for Money Wave Buy Signals soon.
Commodity Investments did not make New Highs and are correcting back down to the 50-day averages for maybe one more bounce up… Most of the Tech Stocks are weaker and no longer meet the Green Line Rules.
The Stock Indices need to hold at the March lows (Support) to remain Bullish. We will use Inverse Funds in the next Bear Market, but only SARK and EUM Inverse Funds currently meet the Green Line Rules.
Currently the tangible Commodities are Way Above the Green Lines, and Bonds are Way Below the Green Lines. Both will eventually return to the Green Lines, so maybe we will see a Stock Market rally when Interest Rates and Inflation fall. (Big surprise for Tammy.)
If you continue to Follow the Green Line System, your Money should flow into the Strongest areas and your account value should be able to grow in both Bull and Bear Markets.
More action this week on the Day Trading Scrolling Charts.
DAY TRADING CHARTS FOR INDICES & LARGE CAPS.
We have not had many intra-day Trade Alert signals lately as the Volume has been too Low with the Buy Signals. These low Volume Buy Signals tend to pop up and quickly fade back down. We like to see High Volume on rallies.
For the week the Dow was down 1.75%, the S&P 500 was down 2.68%, and the NASDAQ 100 was down 3.85%. The Long Term Trend for the Indices is up.
The Inflation Index (CRB) was down 2.47% for the week and is Above the Green Line, indicating Economic Expansion.
Bonds were up 0.63% for the week, and are Way Below the Green Line, indicating Economic Expansion.
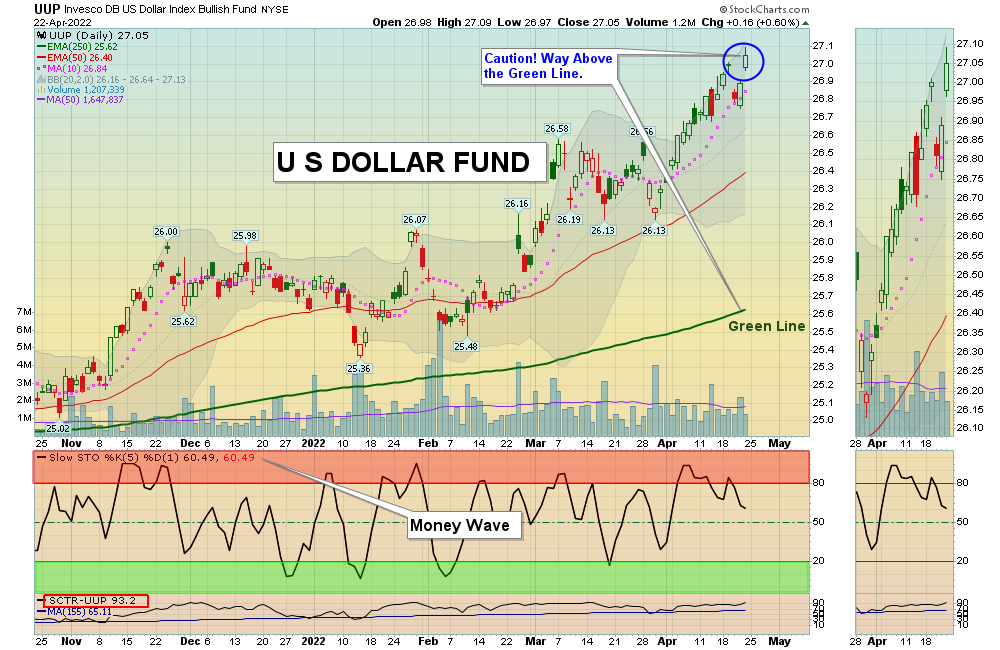
The US DOLLAR was up 0.82% for the week and is Way Above the Green Line.
Crude Oil was down 4.56% for the week at $102.07 and GOLD was own 2.06% at $1934.30.
_____________________________________________________________________________________________
MONEY WAVE BUYS SOON
We are in only 3 logged Current Positions for the Short & Medium Term, and we have CASH to Buy 7 more soon. There are 6 investments on the Short Term Watch List.
Be patient and WAIT for Green Zone Buy Signals!
_________________________________________________________________________________________
LONG TERM INVESTMENTS (Hard to find many Long Term now because most no longer have 80 Relative Strength required.)
Long Term Scrolling Charts (Real Time)
BLDR BUILDERS FIRSTSOURCE Buy above $63.99 with High Volume with a 5% Trailing Sell Stop Loss below it.
F FORD MOTOR CO. Buy if it Closes above $17.80 with High Volume.
RRPIX RISING INTEREST RATES FUND Currently in the Weekly Chart Red Zone. Wait for the next Daily Money Wave Buy Signal.
________________________________________________________________________________
My Trading Dashboard
Swing Trading Scrolling Charts
Day Trading Scrolling Charts
Click for Watch Lists
Click for Current Positions
Click for Closed Positions
Updated Top 100 List Apr 2, 2022
Dividend Growth Portfolio
Updated ETF Sector Rotation System
Dogs of the DOW System
Long Term Strategy for IRAs & 401k Plans
CNN Fear & Greed Index
Scrolling Stage Chart Investing Charts
Alert! Market Risk is MEDIUM (Yellow). The probability of successful Short Term Trades is better, when the % of stocks above the 50-day avg. is below 20.
Tell your Friends about the Green Line, and Help Animals.
________________________________________________________________________________
QUESTION: Winter writes ““Don’t take a Loss” confuses me. What does that mean?”
ANSWER: When the Investment has a Money Wave Buy Signal, it should pop up 3-6 % in just a few days.
If it is not popping up well, and the Money Wave > 50, either Get out soon , and Don’t Take a Loss! (Get Out Even).
Something must be Wrong. There will be plenty more Money Wave Signals soon… Raise Cash, and don’t get Stuck! Wait for the next one.
Good trading and tell your friends!
ATGL