Above the Green Line -01
  • Market Insights
        • Commentary
          • Daily
          • Weekly
        • BUY / SELL SIGNALS
          • Trade Posts
          • Recent Trade Alerts
          • Recent Day Trades
        • BLOGROLL
          • Dividend Growth Blog
          • ETF Sector Blog
          • Dow Dogs
          • TPOW Blog
  • Strategies
        • SWING TRADING
          • Current Positions
          • Watchlists
          • Closed Positions
          • Candidates - TOP 100
          • Specialty Stocks
        • WEEKLY STOCK PICK
          • TPOW Charts
          • TPOW Performance
          • TPOW Strategy Guide
          • TPOW Performance Dashboard
        • DAY TRADING
          • Watch List
        • ATGL DASHBOARD
        • ETF STRATEGIES
          • ETF Sector Rotation
          • ETF Sector Portfolio
        • DIVIDEND GROWTH
          • Dividend Growth Portfolio
          • Dividend Calendar
        • DOGS OF THE DOW
          • Dogs of the Dow Portfolio
          • DOW 5 Portfolio
  • Markets
        • US MARKET
          • Commodities
          • Energy
          • Precious Metals
          • Volatility
        • GLOBAL MARKETS
          • Market Indices
          • Economic Calendar
          • FOREX Heat Map
          • FOREX Cross Rates
          • Crypto Currency Market
  • Investing
    • Discord Community
    • Dashboard
  • Resources
        • ARTICLES
          • Dividend Growth Model Articles
          • ETF Articles
          • Investment Strategies Articles
          • Market and Economic Insights
          • Stock Trade Articles
          • Stock Reviews
        • TOOLS
          • Stock Scanners
          • Charting Software
          • Brokerage Firms
        • STOCK CHARTS
          • Key Components
          • Reading Charts
          • Drawing Stock Charts
          • Identifying Trends
        • RETIREMENT PLANNING
  • About
    • Contact Us
    • How to Win
    • #1 At Stockcharts
    • Disclaimer
    • FAQ
  • Log In
  • Subscribe

April 18, 2021

Green Line Weekly Apr 18, 2021

SPX 200 Chart
The Media, the FED, and GREED convince most that it is OK to Buy up in the Sell Zone.

4/18/2021 Markets were higher again for the week and the S&P 500, the NASDAQ 100, and DOW 30 Indices were able to make New Highs again. But the Small Caps and many Leaders still need to make New Highs for the 1 year rally to continue. 

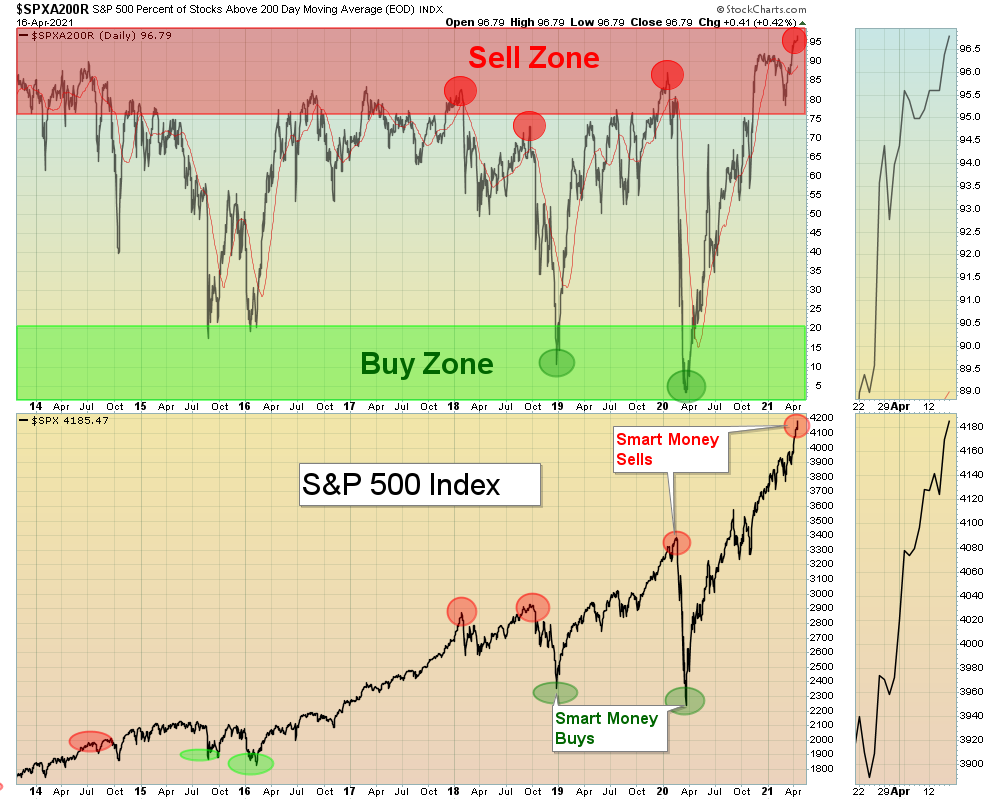
Did your Emotions allow you to Buy last Spring when the Markets tanked from the Virus? Most Investor did not Buy then because the Media scared them into waiting, or Selling. Now the Media is talking about how good everything is, and most are piling into the Markets after a HUGE 85 % rally. From the Chart above, you can see where Smart Money (and the Green Line) completely ignored the Media and bought last year in the Green Buy Zone. Now Smart Money is Taking Profits (Distributing) Huge Gains to the HERD.

A monkey can be trained to Buy in the Buy Zone, and Take Profits in the Sell Zone. But monkeys do not have Human Emotions, and are not Greedy. Smart Money is the same way: Buy Fear and Sell Greed. Smart Money has a roadmap to follow the Money, like the Chart above. What is your roadmap?

SEE SUPPLEMENTAL CHARTS

For the week the Dow was up 1.22%, the S&P 500 was up 1.40%, and the Nasdaq 100 was up 1.45%. The Long Term Trend for the Indices is up.  

The Inflation Index (CRB) was up 3.46% for the week and is Above the Green Line, indicating Economic Expansion.

Bonds were up 1.27% for the week, and are Below the Green Line, indicating Economic Expansion.

The US DOLLAR was down 0.64% for the week. 

Crude Oil was down 3.47% for the week at $59.32 and GOLD was up 0.95%  at $1744.80.

_____________________________________________________________________________________________

MONEY WAVE BUYS SOON

We are currently in 3 logged Current Positions, for the Short & Medium Term.  There are 8 Investments on the Short Term Watch List. 

Be patient and WAIT for Green Zone Buy Signals!

______________________________________________________________________________________________

LONG TERM INVESTMENTS  (Several Leaders have pulled back, but Markets are on Highs.)

SCROLLING Charts (Real Time)

BE      BLOOM ENERGY CORP.       Buy if it Closes above the Red Line (50-day avg.) with High Volume.  
FCEL      FUELCELL ENERGY INC.       Buy if it Closes above the Red Line (50-day avg.) with High Volume.     
LAC      LITHIUM AMERICAS FUND      Buy if it Closes above the Red Line (50-day avg.) with High Volume
PLUG      PLUG POWER INC.      Buy if it Closes $39.97 with High Volume.   
XBI      BIOTECH FUND        Buy if it Closes above the Red Line (50-day avg.) with High Volume.     

______________________________________________________________________________________

Click for  Watch Lists
Click for  Current Positions
Click for  Closed Positions

New: My Trading Dashboard

Day Trading Watch List
NEW TOP 100 LIST Apr 4, 2021
Dividend Growth Portfolio  
ETF Sector Rotation System      
Dogs of the DOW System
Long Term Strategy for IRAs & 401k Plans
CNN Fear & Greed Index
Scrolling Stage Chart Investing Charts

Alert! Market Risk is HIGH (Red Zone). The probability of successful Short Term Trades is better, when the % of stocks above the 50-day avg. is below 20. 

Tell your Friends about the Green Line, and Help Animals.

___________________________________________________________________________________________

QUESTION:  Kinch writes “I am only receiving a notification about the market about 20 minutes before the market closes.  I never get a text message about any trades. Is this the way it works?”


ANSWER:  Hi Kinch. Most subscribers do best with the End of Day Swing Trading (email arrives just before the Market Close).

We do send out Day Trade Alerts by Twitter, if you want to set up a free Twitter account. These Alerts are also on the Main Menu:  Stock Alerts

For Twitter, please install the app on your cell, and set up mobile notifications:

Please Follow Us @AboveGreenLine on Twitter  and click on the bell icon to set up mobile notifications.

Thanks for writing,

ATGL

Related Post

– Green Line Weekly Apr 11, 2021

Subscribe to Our Newsletter

AGL Logo

Get our eBook Now!

Candlestick - A Swing Traders Friend

We don’t spam! Read our privacy policy for more info.

You’ve been successfully subscribed to our newsletter!

Voted #1 at Stock Charts

SH Chart
Inverse S&P 500 Fund (SH) will have a Money Wave Buy today.

Help Us Help Animals

Help Us Help Animals

Recent Comments

  • Want to Protect Your Capital? Start With Better Position Sizing on Risk Management in Trading: Tools and Techniques
  • Want to Protect Your Capital? Start With Better Position Sizing on Swing Trading Risk Management: Tips To Safeguard Your Profits
  • Price Action Trading Strategies That Work in Any Market on What Is a Death Cross in Stocks? A Bearish Market Signal
  • ATGL Weekly Money Flow - 2025-07-13 on AGTL Top Pick of the Week! May 11, 2025
  • Market Breadth Indicators: A Trader’s Guide to Early Trend Detection on Backtesting: Definition and How a Trading Strategy Backtest Works

Become a Green Liner!

Help me make more Money in the Stock Market.

ON ATGL

  • DashBoard
  • Weekly Commentary
  • Daily Buy / Sell Signals
  • Day Trade Setup
  • Trading Rooms

Design & Develop By Pixelvect

STRATEGIES

  • Swing Trading
  • ATGL Pick of the Week
  • Dividend Growth
  • ETF Sector Rotation
  • Dogs of the Dow

HELP

  • ATGL Trading Rules
  • FAQ
  • Account Maintenance
  • Contact US
  • Join

FOLLOW US

Instagram Linkedin Twitter Facebook

© COPYRIGHT 2024 · ABOVETHEGREENLINE.COM · ALL RIGHTS RESERVED · PRIVACY · TERMS · CONTACT · WATCHLIST · CURRENT