
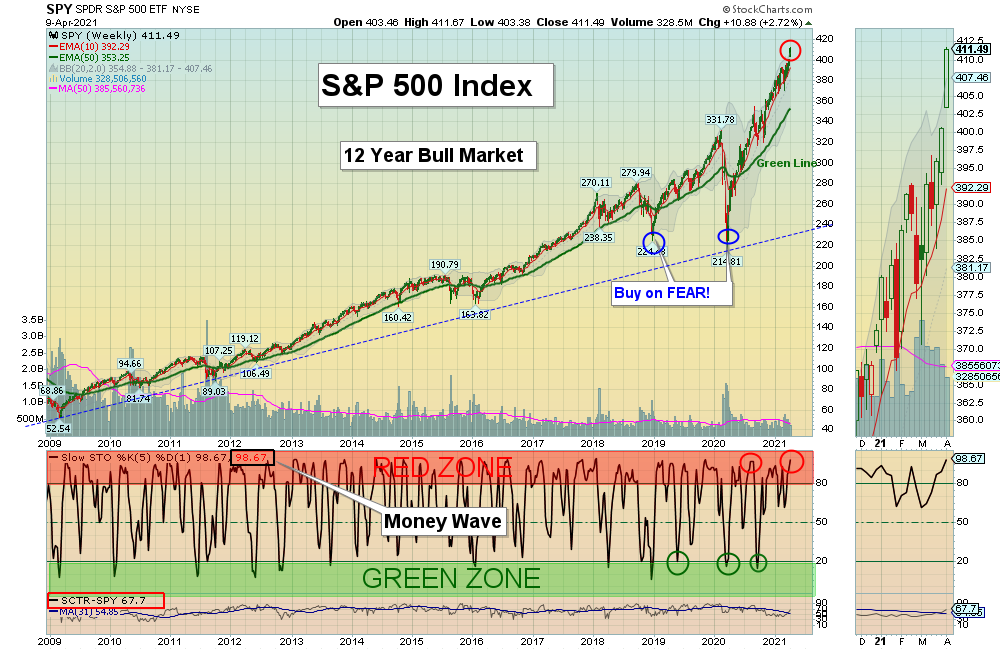
4/11/2021 Markets were higher for the week and the S&P 500 and DOW 30 Indices were able to make New Highs again. But the Small Caps, NASDAQ 100 and the Leaders still need to make New Highs for the 1 year rally to continue. So far the Buying Volume has been low, and there are several warning signs that the 88 % rally of the S&P 500 Index in the last year is about to have a Correction. New subscribers will learn that all Investments will eventually return to their Green Lines.
This is no longer a normal Market. Human Emotions are forcing undisciplined Investors to Buy High. There is not an infinite amount of $$$ to go into the Markets, and most Investors are now Fully Invested on all of the Good News (Virus Ending & more Stimulus $$$). The current temporary Bullish optimism will fade, so Smart Money is Distributing their Stocks up here for Cash. Think about it: Volume is Low… Where are all the Buyers?
Most Investors will not Sell now because the FED has promised Printing for the rest of this year, maybe longer. So Trillions of Dollars have entered the Markets at historically high valuations. The FED said they will continue to Print and allow inflation to run moderately above the FED’s 2 % goal, for some time. But the March PPI just came out at +1 % (12 % annualized), and the 12 month advance is the largest since 2011.
So if the FED is wrong (again) and are forced to end Printing early because of Inflation, the Markets won’t like it. Bonds already see Inflation coming and are down 22 % in a year. Maybe the FED will not really be wrong, but is simply misleading Investors at the direction of the Oligarchy. The FED is a simply a Board of 7 Governors that make $200K annually, but effect Trillions of $$$.
For the week the Dow was up 1.93%, the S&P 500 was up 2.72%, and the Nasdaq 100 was up 3.86%. The Long Term Trend for the Indices is up.
The Inflation Index (CRB) was up 0.02% for the week and is Above the Green Line, indicating Economic Expansion.
Bonds were unchanged for the week, and are Below the Green Line, indicating Economic Expansion.
The US DOLLAR was down 0.80% for the week.
Crude Oil was down 3.47% for the week at $59.32 and GOLD was up 0.95% at $1744.80.
_____________________________________________________________________________________________
MONEY WAVE BUYS SOON
We are currently in 4 logged Current Positions, for the Short & Medium Term. There are 9 Investments on the Short Term Watch List.
Be patient and WAIT for Green Zone Buy Signals!
______________________________________________________________________________________________
LONG TERM INVESTMENTS (Several Leaders have pulled back, but Markets are on Highs.)
BE BLOOM ENERGY CORP. Buy if it Closes above the Red Line (50-day avg.) with High Volume.
FCEL FUELCELL ENERGY INC. Buy if it Closes above the Red Line (50-day avg.) with High Volume.
LL LUMBER LIQUIDATORS Buy if it Closes above $26.80 on High Volume.
PLUG PLUG POWER INC. Buy if it Closes $39.97 with High Volume.
ROKU ROKU INC. Up 12.58 % this week. Missed it.
XBI BIOTECH FUND Buy if it Closes above the Red Line (50-day avg.) with High Volume.
Z ZILLOW GROUP Up 8.77 % this week. Missed it.
______________________________________________________________________________________
Click for Watch Lists
Click for Current Positions
Click for Closed Positions
New: My Trading Dashboard
Day Trading Watch List
NEW TOP 100 LIST Apr 4, 2021
Dividend Growth Portfolio
ETF Sector Rotation System
Dogs of the DOW System
Long Term Strategy for IRAs & 401k Plans
CNN Fear & Greed Index
Scrolling Stage Chart Investing Charts
Alert! Market Risk is HIGH (Red Zone). The probability of successful Short Term Trades is better, when the % of stocks above the 50-day avg. is below 20.
Tell your Friends about the Green Line, and Help Animals.
___________________________________________________________________________________________
QUESTION: John C. writes “Hi. I have been using your methods with quite good success over the past year, but lately I have been wondering something. Sometimes you post a daily chart for a company, but other times you post a weekly chart. For swing/momentum trading, which chart is best to go by, because looking at both, side to side, the Money Waves are quite different.
Many thanks, John C.
ANSWER: Hi John. The Green Line System is based on Buying the Leaders in the Green Zone, and taking Profits in the Red Zone.
The Daily Chart cycle usually takes 1-3 weeks and the Weekly Chart takes 1-3 months. If you Buy the Weekly, don’t look at the Daily, as the Daily will cycle thru many times and be confusing. Pick only 1 Time Frame, and stick with it.
Many will use a shorter term Time Frame for ENTRY only, then go back to your Main Chart decision.
Thanks for writing.
ATGL
