
3/27/2021 Markets were higher for the week as the Indices bounced up off the Red Lines (50-day avgs.) and should re-test the recent Highs. Many Leaders and Indices went down into the Green Zones and then turned up on Thursday & Friday for Short Term Buy Signals.
Now the Leaders need to make New Highs for the 1 year rally to continue. So far the Buying Volume has been low, which could mean that most Investors are now Fully Invested on all of the Good News (Virus Ending & more Stimulus $$$).
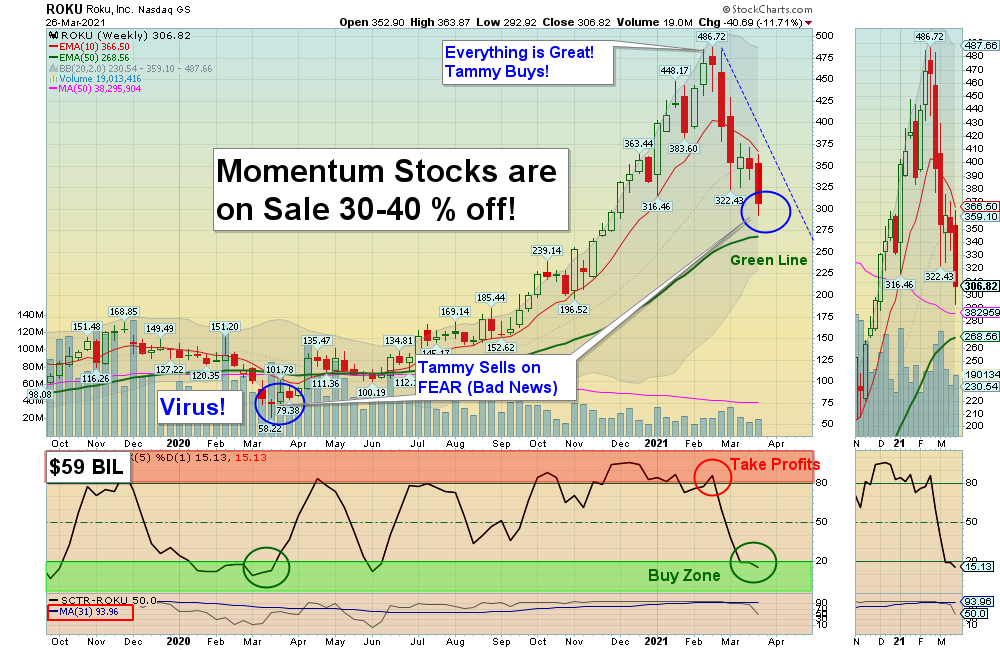
The major Indices have rallied up 74 – 148% from the Lows of last March, without much of a pullback. Historically when the rally from last March is complete, the rally could give up 1/4 to 1/2 of the move up. Many Momentum Stocks have recently dropped 30-40 % on normal Tammy flushing, and the ones that hold above the Green Lines + above 80 Relative Strength (for Long Term) should go back up to re-test the Highs.
ROKU Inc. (see chart above) was 80 % Above the Green Line and in the weekly Red Zone last month, so Smart Money took profits to be able to Buy again lower. Tammy did not know that ROKU was $200 over-priced at $486 from Greed. Now she is dumping it for a $180 loss because she is scared, and we will be happy to Buy from Tammy when the timing is right. See more Momentum Stocks that are on Sale below (under Long Term Investments).
For the week the Dow was up 1.41%, the S&P 500 was up 1.76%, and the Nasdaq 100 was up 1.04%. The Long Term Trend for the Indices is up.
The Inflation Index (CRB) was down 0.56% for the week and is Above the Green Line, indicating Economic Expansion.
Bonds were up 1.42% for the week, and are Below the Green Line, indicating Economic Expansion.
The US DOLLAR was up 0.81% for the week and is returning up near the Green Line..
Crude Oil was down 0.76% for the week at $60.97 and GOLD was down 0.54% at $1732.30.
_____________________________________________________________________________________________
MONEY WAVE BUYS SOON
We are currently in 6 logged Current Positions, for the Short & Medium Term. There are 6 Investments on the Short Term Watch List.
Be patient and WAIT for Green Zone Buy Signals!
______________________________________________________________________________________________
LONG TERM INVESTMENTS (Several Leaders have pulled back near the Green Lines.)
SCROLLING Charts (Real Time)
ARKK ARK INNOVATION ETF Wait for the next Daily Money Wave Buy Signal.
BE BLOOM ENERGY CORP. Wait for the next Daily Money Wave Buy Signal.
FCEL FUELCELL ENERGY INC. Buy if it Closes above the Pink Line (10-day avg.) with High Volume.
LL LUMBER LIQUIDATORS Buy if it Closes above $26.80 on High Volume.
NIO NIO INC. Wait for the next Daily Money Wave Buy Signal.
PLUG PLUG POWER INC. Buy if it Closes $39.97 with High Volume.
PTON PELOTON INTERACTIVE Buy if it Closes above $119.12 on High Volume.
ROKU ROKU INC. Buy if it Closes above the Pink Line (10-day avg.) with High Volume.
TSLA TESLA INC. Wait for the next Daily Money Wave Buy Signal.
XBI BIOTECH FUND Buy if it Closes above the Pink Line (10-day avg.) with High Volume.
______________________________________________________________________________________
Click for Watch Lists
Click for Current Positions
Click for Closed Positions
New: My Trading Dashboard
Day Trading Watch List
NEW TOP 100 LIST Mar 1, 2021
Dividend Growth Portfolio
ETF Sector Rotation System
Dogs of the DOW System
Long Term Strategy for IRAs & 401k Plans
CNN Fear & Greed Index
Alert! Market Risk is HIGH (Red Zone). The probability of successful Short Term Trades is better, when the % of stocks above the 50-day avg. is below 20.
Tell your Friends about the Green Line, and Help Animals.
___________________________________________________________________________________________
QUESTION: Arvind writes “I joined Green Line 2 days ago. How do I get a chart of my chosen ticker symbol?”
ANSWER: Hi Arvind, if you go down to the link on the Daily emails: ARE YOUR INVESTMENTS ABOVE THE GREEN LINE?
you can pull up your own Charts.
Thank you,
ATGL
