
By ATGL
Updated April 2, 2025
The double top pattern ranks as one of the trading patterns you should know when conducting technical analysis. This formation appears frequently across various timeframes and markets, serving as a powerful bearish reversal signal that experienced traders monitor closely. Understanding this pattern provides valuable insight into potential market direction shifts and offers strategic trading opportunities.
What Is a Double Top Pattern?
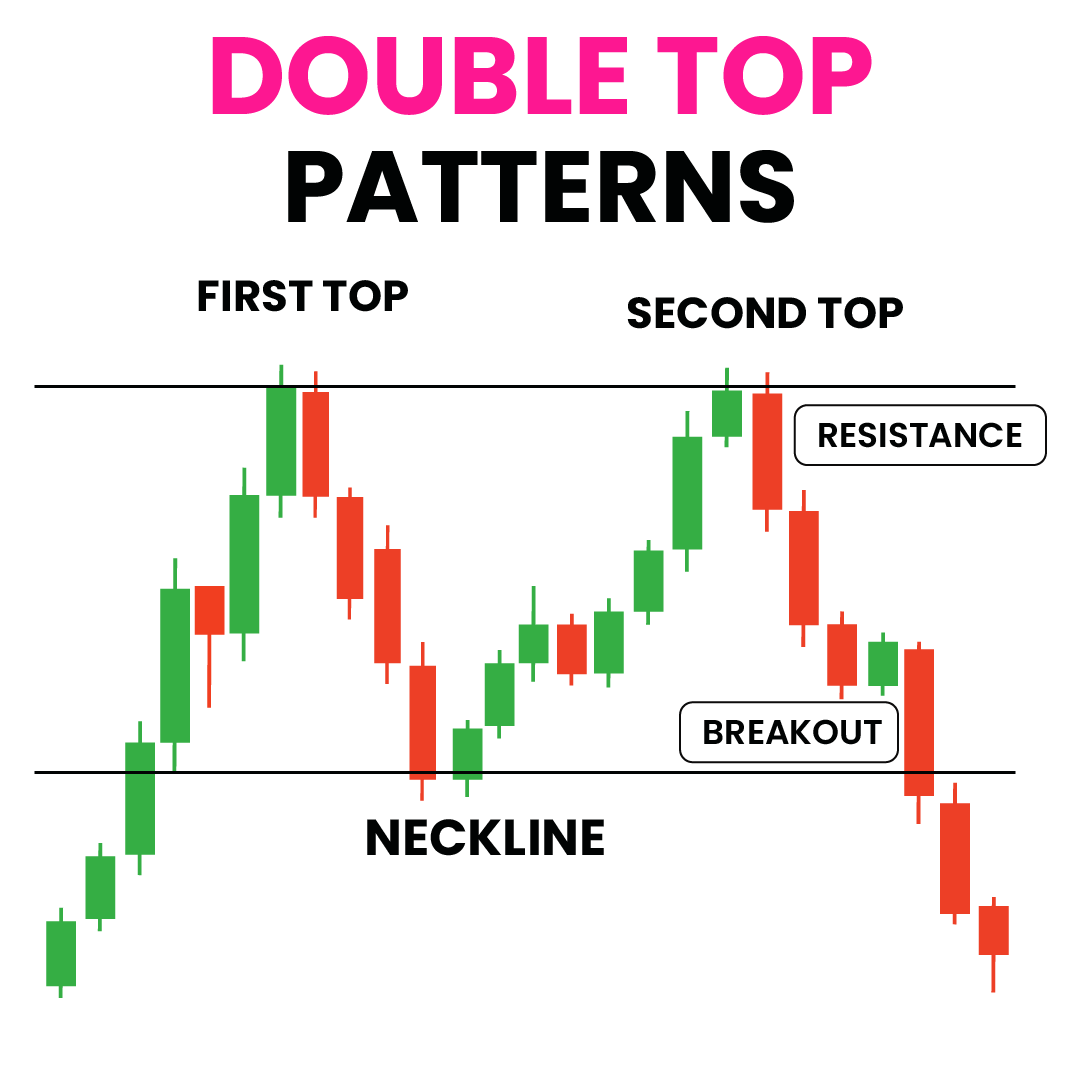
The double top pattern consists of two consecutive peaks at approximately the same price level, separated by a moderate trough. This formation typically emerges after an extended uptrend when the price fails to break through a resistance level on two separate attempts. The pattern completes when the price drops below the support level (neckline), connecting the two troughs between the peaks.
Is the double top pattern bullish? No, this pattern signals a bearish sentiment. It indicates that buyers failed twice to push prices above a specific resistance point, suggesting diminishing buying pressure and increasing selling interest. This failure to establish new highs often precedes a significant downward movement as sellers gain control of the market. The pattern reflects a shift in market psychology from optimism to caution and eventually to pessimism.
The rule for double top pattern identification requires two distinct peaks at approximately the same price level with a noticeable valley between them, followed by a break below the neckline support. Volume often decreases during the second peak and increases during the subsequent decline, confirming the pattern’s validity.
Difference Between Double Top and Double Bottom
While the double top indicates bearish reversals, the double bottom pattern represents its bullish counterpart. Double bottoms form after downtrends when prices make two unsuccessful attempts to break below a support level. This creates a “W” shape, signaling potential upward momentum. The psychology differs fundamentally — double tops reflect resistance to further upward movement, while double bottoms demonstrate support against continued decline.
Both patterns operate on similar principles of failed attempts to break significant price levels, but they predict opposite market directions. Traders often analyze these patterns together with other formations like the head and shoulders pattern or triangle chart pattern to confirm market sentiment shifts.
Identifying the Double Top Pattern
Accurate identification of the double top pattern requires attention to several key characteristics:
- Visual Appearance: The pattern resembles the letter “M” on price charts, with two peaks reaching similar heights.
- Price Levels: The two peaks should reach approximately the same price level, ideally within 3% of each other.
- Timeframe: The formation typically develops over several weeks in longer timeframes, though it appears in shorter timeframes as well.
- Volume Profile: Volume often decreases during the second peak compared to the first, indicating waning buying interest.
- Neckline Confirmation: The pattern confirms when price breaks below the neckline — the support level connecting the trough between the peaks.
Avoid mistaking normal price fluctuations for genuine double top patterns. The peaks must represent significant resistance levels rather than minor price oscillations.
Formation of the Double Top Pattern
The double top pattern develops through three distinct phases. Initially, prices rise during an established uptrend, reflecting strong buying pressure and market optimism. This momentum carries the price to a new high before encountering resistance.
In the second phase, after reaching the initial peak, prices retrace as profit-taking occurs. This pullback typically ranges between 10% and 20% from the peak before buying interest returns. When prices rally again to approach the previous high, they encounter resistance at approximately the same level. The second failure to break through this ceiling demonstrates that buyers lack sufficient strength to establish new highs.
The final phase begins when prices fall from the second peak and break below the neckline support level. This breach confirms the pattern completion and signals the transition to a bearish trend. The psychology behind the double top pattern reflects changing market sentiment — initial optimism gives way to uncertainty after the first failure, then to pessimism after the second rejection.
What Happens After a Double Top Pattern?
Following a confirmed double top pattern, prices typically decline substantially. The statistical success rate of the double top pattern ranges between 65% and 70% in predicting meaningful downward movements. The expected price target often equals the distance from the peaks to the neckline, projected downward from the breakout point.
After the initial breakdown below the neckline, prices may temporarily retest this level from below, now acting as resistance rather than support. This retest provides an additional entry opportunity for traders who missed the initial breakdown.
Market volatility frequently increases during the post-pattern decline as more participants recognize the bearish reversal. Supporting technical indicators like the Relative Strength Index (RSI) or Moving Average Convergence Divergence (MACD) often confirm the downward momentum with bearish divergences or crossovers.
How To Trade a Double Top Pattern
Trading the double top pattern effectively requires a systematic approach:
Determining Strategic Entry Points: The safest entry occurs after confirmation, when prices close decisively below the neckline on increased volume. More aggressive traders may enter at the second peak if accompanied by bearish signals like divergences on momentum indicators. Additionally, the previously mentioned neckline retest offers another potential entry opportunity.
Setting Proper Exit Points: Calculate profit targets using the measured move technique — measure the vertical distance from peaks to neckline and project this distance below the breakout point. Implement a tiered profit-taking approach by closing portions of positions at different levels.
Implementing Stop-Loss Orders: Place stop-loss orders above the second peak to limit potential losses if the pattern fails. For more conservative risk management, position the stop-loss just above the neckline once prices break below it.
The bear flag pattern or bear pennant pattern may form during the decline following a double top, offering additional trading opportunities. Conversely, if prices unexpectedly move above the second peak, patterns like the cup and handle pattern or bull flag pattern might emerge instead.
Common Mistakes in Double Top Pattern Recognition
Several errors frequently undermine successful double top pattern trading:
- Premature Pattern Identification: Mistakes minor price fluctuations for completed double tops before the neckline breaks.
- Ignoring Volume Confirmation: Fails to verify declining volume at the second peak and increasing volume at the breakdown.
- Peak Height Discrepancy: Identifies patterns where the peaks differ significantly in height or occur too close together temporally.
- Neglecting Market Context: Trades the pattern in isolation without considering broader market conditions or prevailing trends.
- Overlooking Timeframe Analysis: Fails to check if the pattern appears across multiple timeframes for confirmation.
Confusing the double top with complex formations like the triple top pattern or mistaking a rising wedge pattern for a developing double top also leads to trading errors.
Trade the Double Top Pattern Effectively With Above the Green Line
Mastering the double top pattern provides a powerful tool for identifying potential market reversals and executing profitable trades. This pattern’s relatively high reliability, when correctly identified, makes it valuable for both novice and experienced traders.
For traders seeking to refine their technical analysis skills and develop comprehensive trading strategies incorporating patterns like the double top, Above the Green Line’s membership offers specialized resources, expert guidance, and advanced pattern recognition tools. These resources help you identify high-probability setups, determine optimal entry and exit points, and manage risk effectively across diverse market conditions.
By combining pattern recognition with disciplined trade management and proper risk assessment, traders maximize their potential for consistently profitable results when trading the double top pattern.

Related Articles

Margin Call Explained: What Triggers It and How to Avoid One

AMC Short Squeeze Explained: Timeline, Causes, and Trading Risks

Volatility Clustering in Financial Markets: Understand Why It Happens

Chaikin Money Flow (CMF): How to Use Volume to Spot Real Market Strength

[…] profitable positions into losses within days. While most traders focus on popular formations like double top patterns, the island reversal pattern offers early technical clues that frequently escape notice. This […]