
By ATGL
Updated July 4, 2025
Technical analysis provides traders with powerful tools to interpret market movements and anticipate price action. Among chart formations, the diamond top pattern stands out as a valuable bearish reversal signal that helps identify potential market turning points. This distinctive diamond-shaped formation occurs when an uptrend weakens, creating specific price action that experienced traders learn to recognize and capitalize upon.
This guide will explore the technical characteristics of the diamond top chart pattern, provide practical trading strategies, and demonstrate how to integrate it into your broader investment strategy.
What Is The Diamond Top Pattern?
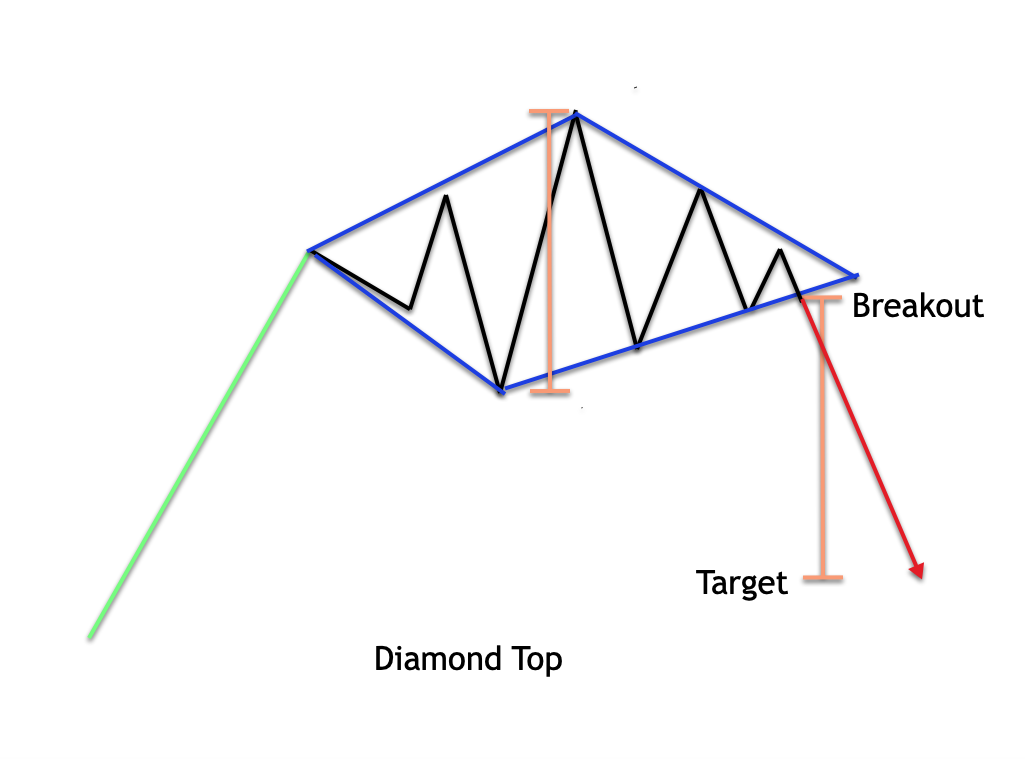
The diamond top pattern represents a bearish reversal formation that typically appears after an extended uptrend, signaling potential weakness in buying pressure and an impending shift toward lower prices. This diamond pattern top forms when price action creates a distinctive diamond shape, characterized by expanding volatility followed by contracting price movements within converging trendlines.
The formation begins when an uptrending stock experiences increased volatility, causing prices to swing between higher highs and lower lows in an expanding pattern. As the pattern develops, these swings gradually narrow, creating the diamond’s pointed bottom. The entire diamond top stock pattern resembles a geometric diamond, with the widest part occurring in the middle and tapering points at both ends.
A diamond pattern in stocks functions as a trend reversal indicator, specifically signaling the end of upward price movement. The diamond top is definitively bearish, indicating that upward momentum has exhausted itself and downward pressure will likely dominate future price action. Traders view confirmed diamond top breakdowns as opportunities to initiate short positions or exit long positions.
Diamond Top Formation: A Technical Breakdown
The technical construction involves four distinct phases:
- During the initial expansion phase, price volatility increases as the stock moves higher with progressively wider swings.
- The second phase involves continued expansion with higher highs and lower lows extending further from the central trendline, representing maximum volatility.
- The third phase marks contraction, where price swings gradually narrow as upper resistance and lower support lines converge.
- The final phase involves pattern resolution when prices break below the lower support trendline with convincing volume, confirming the bearish implications.
Recognizing The Diamond Top Stock Pattern In Real Time
Identifying diamond top patterns during live trading requires attention to specific visual cues that distinguish this formation from other chart patterns. The diamond shape should be clearly visible when connecting key highs and lows with trendlines. These formations almost always occur after significant uptrends of at least 20% to 30%.
The timeframe consideration plays a vital role, as diamond top formations require adequate time to develop. Patterns forming over several weeks or months tend to be more reliable than those appearing over days. Day trading patterns that resemble diamonds but form too quickly often represent noise rather than meaningful reversal signals.
Volume behavior provides critical confirmation. During initial expansion, volume typically increases as volatility rises. The most important volume signal occurs during the breakdown, when trading activity should increase substantially to confirm the bearish reversal. Volume confirmation represents the most important aspect of validating a diamond top formation, as breakdowns without adequate volume may represent false signals.
Key Trading Strategies For The Diamond Top Formation
Trading the diamond top pattern effectively requires systematic approaches addressing entry timing and risk management. The most conservative strategy involves waiting for a confirmed breakdown below the pattern’s lower support line before initiating short positions. More aggressive traders might enter as the pattern approaches completion if volume patterns suggest weakening buying interest.
Success rates for diamond top patterns suggest that properly identified formations result in successful trades approximately 60% to 70% of the time when combined with appropriate risk management. The diamond top pattern offers several trading opportunities beyond initial breakdown, including secondary bounces back toward broken support levels.
Entry And Exit Techniques
Optimal entry techniques focus on confirmation rather than anticipation. The most reliable entry signal occurs when prices break below the pattern’s lower support line with volume exceeding recent averages by at least 50%. This breakdown should occur on a closing basis rather than an intraday breach.
Stop-loss placement should be above the pattern’s highest point for conservative approaches, while aggressive traders might use recent swing highs. Profit targets can be established using the pattern’s height measured from highest to lowest point within the formation. This measurement, subtracted from the breakdown level, provides minimum price objectives.
Handling False Signals And Common Pitfalls
Diamond top patterns can produce false signals when prices break below support but quickly reverse back above this level. Volume analysis provides the best defense against false signals — breakdowns on low volume should be viewed with skepticism. Genuine breakdowns typically generate significant trading activity.
Common pitfalls include misidentifying other chart patterns as diamond tops. Triangular formations and head-and-shoulders patterns can sometimes resemble diamond shapes. You should verify that patterns exhibit characteristic expanding-then-contracting price action that defines genuine diamond formations.
Examples Of The Diamond Top Pattern In The Market
Historical examples provide valuable insights into pattern development. Notable examples occurred in the technology sector during early 2021, when several high-growth stocks formed diamond top patterns after extended rallies. The semiconductor industry provided particularly clear examples, with patterns developing over 8 to 12 weeks and resulting in declines of 25% to 40%.
Large-cap stocks tend to form more reliable diamond top patterns due to higher trading volumes and broader institutional participation. Market indices have also formed diamond top patterns at significant peaks, providing early warnings of larger corrections.
How The Diamond Top Pattern Fits Into Overall Trading Strategy
Integrating diamond top patterns into comprehensive trading strategies requires understanding how these formations complement other technical analysis tools. The pattern works most effectively when combined with momentum indicators, moving averages, and volume analysis that confirm bearish implications.
Many successful traders use diamond top patterns as part of broader investment strategies incorporating multiple timeframes. Risk management integration represents a crucial aspect, with these patterns representing only a portion of overall trading capital.
The pattern’s longer development timeframe makes it suitable for swing trading approaches rather than day trading strategies. Advanced strategies for investment might involve using diamond top patterns to identify sector rotation opportunities, as weakness in one area often coincides with strength in defensive sectors.
Take Action With Confidence Using The Diamond Top Pattern
Mastering the diamond top pattern provides you with a powerful tool for identifying potential market reversals and capitalizing on bearish trends. Success lies in patient pattern recognition, careful volume analysis, and disciplined risk management accounting for false signals.
The approach outlined here offers a framework for incorporating diamond top patterns into your trading strategy while maintaining appropriate risk controls. Remember that no single pattern guarantees success, but when properly identified and traded alongside other trading patterns, diamond top formations can contribute significantly to trading performance.
If you’re ready to use professional-grade strategies and develop the technical expertise needed to trade diamond top patterns with confidence, explore Above the Green Line’s comprehensive membership options. Our proven methodologies and expert guidance can help you master these formations and other advanced trading techniques.

Related Articles

Margin Call Explained: What Triggers It and How to Avoid One

AMC Short Squeeze Explained: Timeline, Causes, and Trading Risks

Volatility Clustering in Financial Markets: Understand Why It Happens

Chaikin Money Flow (CMF): How to Use Volume to Spot Real Market Strength
