Above the Green Line -01
  • Market Insights
        • Commentary
          • Daily
          • Weekly
        • BUY / SELL SIGNALS
          • Trade Posts
          • Recent Trade Alerts
          • Recent Day Trades
        • BLOGROLL
          • Dividend Growth Blog
          • ETF Sector Blog
          • Dow Dogs
          • TPOW Blog
  • Strategies
        • SWING TRADING
          • Current Positions
          • Watchlists
          • Closed Positions
          • Candidates - TOP 100
          • Specialty Stocks
        • WEEKLY STOCK PICK
          • TPOW Charts
          • TPOW Performance
          • TPOW Strategy Guide
          • TPOW Performance Dashboard
        • DAY TRADING
          • Watch List
        • ATGL DASHBOARD
        • ETF STRATEGIES
          • ETF Sector Rotation
          • ETF Sector Portfolio
        • DIVIDEND GROWTH
          • Dividend Growth Portfolio
          • Dividend Calendar
        • DOGS OF THE DOW
          • Dogs of the Dow Portfolio
          • DOW 5 Portfolio
  • Markets
        • US MARKET
          • Commodities
          • Energy
          • Precious Metals
          • Volatility
        • GLOBAL MARKETS
          • Market Indices
          • Economic Calendar
          • FOREX Heat Map
          • FOREX Cross Rates
          • Crypto Currency Market
  • Investing
    • Discord Community
    • Dashboard
  • Resources
        • ARTICLES
          • Dividend Growth Model Articles
          • ETF Articles
          • Investment Strategies Articles
          • Market and Economic Insights
          • Stock Trade Articles
          • Stock Reviews
        • TOOLS
          • Stock Scanners
          • Charting Software
          • Brokerage Firms
        • STOCK CHARTS
          • Key Components
          • Reading Charts
          • Drawing Stock Charts
          • Identifying Trends
        • RETIREMENT PLANNING
  • About
    • Contact Us
    • How to Win
    • #1 At Stockcharts
    • Disclaimer
    • FAQ
  • Log In
  • Subscribe

March 19, 2024

Stopped Out TQQQ at $58 for 6 cent Gain.

Day Trade Image

… [Read more...]

September 7, 2021

Triple Buy Signal on Express Inc,.

Day Trade Image

Triple Buy Signal today on EXPR. Buy when all 3 Technical Indicators cross up. Caution! So far the Volume is not High. Note: Buy Alert on EXPR (Day Trade) Triple Buy Signal today on EXPR. … [Read more...]
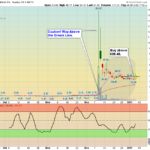
May 27, 2021

Price alert on RAIL

Day Trade Image

RAIL has crossed up through $5.79 to a value of $6.09. Note: Buy Alert on RAIL (Day Trade) Buy above $5.79 on high Volume with a 5% Trailing Sell Stop Loss. … [Read more...]
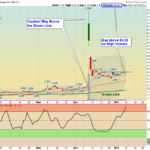
March 29, 2021

Price alert on FUTU

S T Chart

FUTU has crossed up through $119.42 to a value of $125.00. Note: Buy Alert on FUTU (Swing Trade) Buy above $119.42 on high Volume with a 5% Trailing Sell Stop Loss. … [Read more...]

February 19, 2021

Price alert on DTEA

Day Trade Image

DTEA has crossed up through $4.82 but the Volume is not High. Caution. Note: Buy Alert on DTEA (Day Trade) Buy above $4.82 on high Volume with a 5% Trailing Sell Stop Loss. … [Read more...]

February 16, 2021

Price alert on BCRX

S T Chart

BCRX has crossed up through $10.41 to a value of $10.42, but Volume is not High. Avoid. Note: Buy Alert on BCRX (Swing Trade) Buy above $10.41 on high Volume with a 5% Trailing Sell Stop Loss. … [Read more...]

January 12, 2021

Alert on OSTK

OSTK Chart

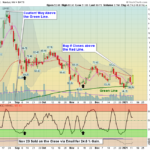
Buy OSTK when it Closes above the Red Line (50-day average of $53.30) on High Volume. Note: Buy Alert on OSTK (Swing Trade) Buy on Close above the Red Line on high Volume with a 5% Trailing Sell Stop Loss. … [Read more...]

January 11, 2021

Price alert on IMMP

IMMP Chart

IMMP has crossed up through $3.30 to a value of $3.33. Volume must be High. Note: Buy Alert on IMMP (Penny Stock Trade) Buy above $3.30 on High Volume with a 5% Trailing Sell Stop Loss. … [Read more...]

January 7, 2021

Price alert on GLSI

GLSI Chart

GLSI has crossed up through $39.53 to a value of $39.55. Note: Buy Alert on GLSI (Penny Stock Trade) Buy above $39.48 with a 5% Trailing Sell Stop Loss. … [Read more...]

January 1, 2021

Day Trading Watch List

Day Trade Image

Watch List - Day Trading Investments Below are Securities that are "On Deck" to be purchased soon. Please allow a few seconds for the table to be displayed in "Real Time".   Real Time Chart Shown below is a Real time chart for the … [Read more...]

  • « Previous Page
  • 1
  • …
  • 32
  • 33
  • 34
  • 35
  • 36
  • …
  • 38
  • Next Page »

Subscribe to Our Newsletter

AGL Logo

Get our eBook Now!

Candlestick - A Swing Traders Friend

We don’t spam! Read our privacy policy for more info.

You’ve been successfully subscribed to our newsletter!

Voted #1 at Stock Charts

SH Chart
Inverse S&P 500 Fund (SH) will have a Money Wave Buy today.

Help Us Help Animals

Help Us Help Animals

Recent Comments

  • Market Breadth Indicators: A Trader’s Guide to Early Trend Detection on Backtesting: Definition and How a Trading Strategy Backtest Works
  • Island Reversal Pattern: Definition and Formation Explained on Double Top Pattern: How to Identify and Trade This Reversal Signal
  • Channel Pattern Guide: What It Is and Why It Matters on A Guide to Forecasting Using Moving Averages
  • What Is a Broadening Bottom Chart Pattern? Full Guide on Bull vs. Bear Market: An Investor’s Guide to Market Phases
  • ATGL Weekly Money Flow - 2025-05-11 on ATGL Top Pick of the Week! Apr 6, 2025

Become a Green Liner!

Help me make more Money in the Stock Market.

ON ATGL

  • DashBoard
  • Weekly Commentary
  • Daily Buy / Sell Signals
  • Day Trade Setup
  • Trading Rooms

Design & Develop By Pixelvect

STRATEGIES

  • Swing Trading
  • ATGL Pick of the Week
  • Dividend Growth
  • ETF Sector Rotation
  • Dogs of the Dow

HELP

  • ATGL Trading Rules
  • FAQ
  • Account Maintenance
  • Contact US
  • Join

FOLLOW US

Instagram Linkedin Twitter Facebook

© COPYRIGHT 2024 · ABOVETHEGREENLINE.COM · ALL RIGHTS RESERVED · PRIVACY · TERMS · CONTACT · WATCHLIST · CURRENT