
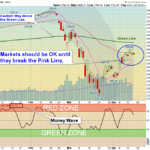
Markets were mixed today as many of the Leaders continued higher. The Selling has been very mild, and it looks like the S&P 500 Index will hold up OK until it breaks the Pink Line (10-day avg.) at 2706 (see Chart above). Most of the … [Read more...]
Money Wave Alert! Apr 16, 2020
Money Wave Alert! Apr 15, 2020
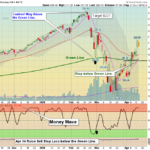
Markets were down today and the S&P 500 Index is back below the Red Line (50-day avg.) of 2810. Most of the Leaders are currently over-bought for the Short Term on Good News about COVID 19. But all of the major Indices except the NASDAQ … [Read more...]
Money Wave Alert! Apr 14, 2020
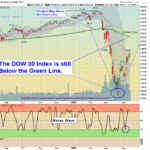
Markets were up today and the S&P 500 Index is trying to Close above the Red Line (50-day avg.) of 2810, which would be Bullish. Some of the Leaders have really popped up in the last few days on Good News about COVID 19. But all of the … [Read more...]
Money Wave Alert! Apr 13, 2020
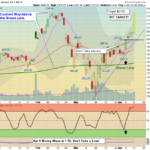
Markets were down today and the S&P 500 Index stalled at the Red Line (50-day avg.) of 2809. Mild profit taking has come in, but some Leaders have gone higher today. This rally from the Lows could be an A-B-C up on Elliott Wave … [Read more...]
Green Line Holiday Video (1 min.)
Related Post - Money Wave Alert! Apr 9, 2020 … [Read more...]
- « Previous Page
- 1
- …
- 305
- 306
- 307
- 308
- 309
- …
- 491
- Next Page »