Above the Green Line -01
  • Market Insights
        • Commentary
          • Daily
          • Weekly
        • BUY / SELL SIGNALS
          • Trade Posts
          • Recent Trade Alerts
          • Recent Day Trades
        • BLOGROLL
          • Dividend Growth Blog
          • ETF Sector Blog
          • Dow Dogs
          • TPOW Blog
  • Strategies
        • SWING TRADING
          • Current Positions
          • Watchlists
          • Closed Positions
          • Candidates - TOP 100
          • Specialty Stocks
        • WEEKLY STOCK PICK
          • TPOW Charts
          • TPOW Performance
          • TPOW Strategy Guide
          • TPOW Performance Dashboard
        • DAY TRADING
          • Watch List
        • ATGL DASHBOARD
        • ETF STRATEGIES
          • ETF Sector Rotation
          • ETF Sector Portfolio
        • DIVIDEND GROWTH
          • Dividend Growth Portfolio
          • Dividend Calendar
        • DOGS OF THE DOW
          • Dogs of the Dow Portfolio
          • DOW 5 Portfolio
  • Markets
        • US MARKET
          • Commodities
          • Energy
          • Precious Metals
          • Volatility
        • GLOBAL MARKETS
          • Market Indices
          • Economic Calendar
          • FOREX Heat Map
          • FOREX Cross Rates
          • Crypto Currency Market
  • Investing
    • Discord Community
    • Dashboard
  • Resources
        • ARTICLES
          • Dividend Growth Model Articles
          • ETF Articles
          • Investment Strategies Articles
          • Market and Economic Insights
          • Stock Trade Articles
          • Stock Reviews
        • TOOLS
          • Stock Scanners
          • Charting Software
          • Brokerage Firms
        • STOCK CHARTS
          • Key Components
          • Reading Charts
          • Drawing Stock Charts
          • Identifying Trends
        • RETIREMENT PLANNING
  • About
    • Contact Us
    • How to Win
    • #1 At Stockcharts
    • Disclaimer
    • FAQ
  • Log In
  • Subscribe

Buy / Sell Signals

September 4, 2019

Money Wave Alert! Sep 4, 2019

QQQ Chart

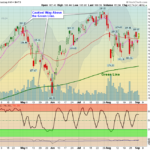
    Markets  were higher today but are still struggling below last week's Highs.  Volume is low, showing poor conviction by today's Buyers as many have FEAR. The FEAR is High, so probably a Stock Rally coming.  The S&P 500 … [Read more...]

September 3, 2019

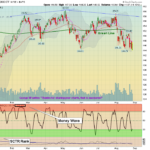
Money Wave Alert! Sep 3, 2019

TLT 60-min Chart

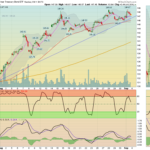
  Markets  were down again today on lower Volume and some unfavorable news. The FEAR is High, so probably a Stock Rally coming. Techs and Semiconductors were under pressure from Trade Fears. The S&P 500 Index stalled up near Resistance … [Read more...]

August 30, 2019

Money Wave Alert! Aug 30, 2019

PAYS Chart

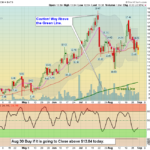
  Markets  were down slightly today as the good Buying has dried up without favorable news. The S&P 500 Index stalled up near Resistance of 2943 this morning, and Sellers came in.  Resistance is 2943. Markets are trying to stay above … [Read more...]

August 29, 2019

Money Wave Alert! Aug 29, 2019

SPX Chart

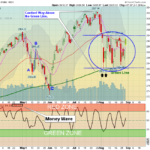
  Markets  were up today on favorable Trade War news. The S&P 500 Index was able to cross above 2900 to bring in more Buying.  Next Resistance is 2943. The Buying on many Stocks has been very tentative today, as Investors are nervous. … [Read more...]

August 28, 2019

Money Wave Alert! Aug 28, 2019

IWM Chart

  Markets  were up today on over-sold Buying. The S&P 500 Index needs to Close above 2900 to bring in more Buying.  Markets are waiting for a Trade War resolution.  New Subscribers: Please be patient and WAIT for the Leaders to pop out … [Read more...]

  • « Previous Page
  • 1
  • …
  • 296
  • 297
  • 298
  • 299
  • 300
  • …
  • 451
  • Next Page »

Subscribe to Our Newsletter

AGL Logo

Get our eBook Now!

Candlestick - A Swing Traders Friend

We don’t spam! Read our privacy policy for more info.

You’ve been successfully subscribed to our newsletter!

Voted #1 at Stock Charts

SH Chart
Inverse S&P 500 Fund (SH) will have a Money Wave Buy today.

Help Us Help Animals

Help Us Help Animals

Recent Comments

  • Market Breadth Indicators: A Trader’s Guide to Early Trend Detection on Backtesting: Definition and How a Trading Strategy Backtest Works
  • Island Reversal Pattern: Definition and Formation Explained on Double Top Pattern: How to Identify and Trade This Reversal Signal
  • Channel Pattern Guide: What It Is and Why It Matters on A Guide to Forecasting Using Moving Averages
  • What Is a Broadening Bottom Chart Pattern? Full Guide on Bull vs. Bear Market: An Investor’s Guide to Market Phases
  • ATGL Weekly Money Flow - 2025-05-11 on ATGL Top Pick of the Week! Apr 6, 2025

Become a Green Liner!

Help me make more Money in the Stock Market.

ON ATGL

  • DashBoard
  • Weekly Commentary
  • Daily Buy / Sell Signals
  • Day Trade Setup
  • Trading Rooms

Design & Develop By Pixelvect

STRATEGIES

  • Swing Trading
  • ATGL Pick of the Week
  • Dividend Growth
  • ETF Sector Rotation
  • Dogs of the Dow

HELP

  • ATGL Trading Rules
  • FAQ
  • Account Maintenance
  • Contact US
  • Join

FOLLOW US

Instagram Linkedin Twitter Facebook

© COPYRIGHT 2024 · ABOVETHEGREENLINE.COM · ALL RIGHTS RESERVED · PRIVACY · TERMS · CONTACT · WATCHLIST · CURRENT