
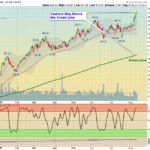
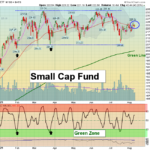
Markets were mostly higher again today as mild Buying continued, especially in the DOW 30 Index. The S&P 500 and DOW 30 Indices made New Highs today while the NASDAQ 100 and Small Caps struggled. Volume was low and the other Indices need to catch … [Read more...]
Money Wave Alert! Aug 11, 2021
Money Wave Alert! Aug 10, 2021
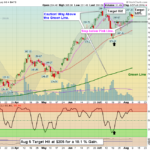
Markets were mostly higher today as the passed a $Trillion Infrastructure Bill. The S&P 500 Index continued to hold up near Highs, but most Tech Stocks were lower. Volume is low and the other Indices need to catch up and make New Highs soon to … [Read more...]
Money Wave Alert! Aug 9, 2021
Markets were mixed to slightly lower today as the S&P 500 Index continued to hold up near Highs. Many Investors seem to be waiting for more Gov't. Stimulus with borrowed money that we don't have. The other Indices need to catch up and make New … [Read more...]
Money Wave Alert! Aug 6, 2021
Markets were higher again today as the S&P 500 Index continues to make New Highs. Most don't want to Sell, but Buying Volume is poor. The other Indices need to catch up and make New Highs soon to keep this rally going. NEW SUBSCRIBERS: It is … [Read more...]
Money Wave Alert! Aug 5, 2021
Markets were higher today as the S&P 500 Index continues to try to make New Highs. Volume is poor, but lots of action today on the DAY TRADING SETUPS. The other Indices need to catch up and make New Highs soon to keep this rally going. NEW … [Read more...]
- « Previous Page
- 1
- …
- 246
- 247
- 248
- 249
- 250
- …
- 499
- Next Page »