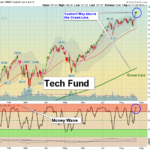
Above the Green Line -01
  • Market Insights
        • Commentary
          • Daily
          • Weekly
        • BUY / SELL SIGNALS
          • Trade Posts
          • Recent Trade Alerts
          • Recent Day Trades
        • BLOGROLL
          • Dividend Growth Blog
          • ETF Sector Blog
          • Dow Dogs
          • TPOW Blog
  • Strategies
        • SWING TRADING
          • Current Positions
          • Watchlists
          • Closed Positions
          • Candidates - TOP 100
          • Specialty Stocks
        • WEEKLY STOCK PICK
          • TPOW Charts
          • TPOW Performance
          • TPOW Strategy Guide
          • TPOW Performance Dashboard
          • Why Weekly Trading Works
        • DAY TRADING
          • Watch List
        • ATGL DASHBOARD
        • ETF STRATEGIES
          • ETF Sector Rotation
          • ETF Sector Portfolio
        • DIVIDEND GROWTH
          • Dividend Growth Portfolio
          • Dividend Calendar
        • DOGS OF THE DOW
          • Dogs of the Dow Portfolio
          • DOW 5 Portfolio
  • Markets
        • US MARKET
          • Commodities
          • Energy
          • Precious Metals
          • Volatility
        • GLOBAL MARKETS
          • Market Indices
          • Economic Calendar
          • FOREX Heat Map
          • FOREX Cross Rates
          • Crypto Currency Market
  • Investing
    • Discord Community
    • Dashboard
  • Resources
        • INVESTING GUIDES
          • Dividend Growth Guide
          • Investment Strategy Framework
          • ETF Investing Handbook
          • Stock Trading Handbook
        • ARTICLES
          • Dividend Growth Model Articles
          • ETF Articles
          • Investment Strategies Articles
          • Market and Economic Insights
          • Stock Trade Articles
          • Stock Reviews
        • TOOLS
          • Stock Scanners
          • Charting Software
          • Brokerage Firms
          • Stocks We Review
        • STOCK CHARTS
          • Key Components
          • Reading Charts
          • Drawing Stock Charts
          • Identifying Trends
  • About
    • Contact Us
    • How to Win
    • #1 At Stockcharts
    • Disclaimer
    • FAQ
  • Log In
  • Subscribe

Buy / Sell Signals

July 15, 2021

Money Wave Alert! Jul 15, 2021

SPY Schart

Markets were mostly lower today as the Indices went down to the Pink Lines (10-day avgs.) and bounced. Closing below the Pink Lines would normally create a Short Term Sell Signal. Many stocks were down today. More talk about when the FED will … [Read more...]

July 14, 2021

Money Wave Alert! Jul 14, 2021

QQQ Chart

Markets were slightly higher today on low Volume Buying. The NASDAQ 100 Index was able to make New Highs on Big Tech Buying. Currently the 10 largest Stocks in the NASDAQ 100 account for 54% of the total Value of the Index (not just 10 %).  This is … [Read more...]

July 13, 2021

Money Wave Alert! Jul 13, 2021

ARKK Chart

Markets were slightly lower today on light profit taking. Consumer Prices rose at a 5.4% annual rate, but the Markets were convinced that Inflation is temporary. Quarterly Earnings are starting to come out. The NASDAQ 100 Index was able to make New … [Read more...]

July 12, 2021

Money Wave Alert! Jul 12, 2021

SPY Chart

Markets were slightly higher today on slow Buying. More New Highs again on 3 major Indices but the number of New Highs on Stocks was small. The Small Cap Index is struggling to get above the 50-day average.  The Indices are stretched Way Above the … [Read more...]

July 9, 2021

Money Wave Alert! Jul 9, 2021

CC Chart

Markets were higher today as the Indices were able to go above Wednesday's High. Even the DOW 30 Index was able to make a New High, but the Small Cap Index is struggling to get above the 50-day average. Volume was low and the weaker Buying is keeping … [Read more...]

  • « Previous Page
  • 1
  • …
  • 244
  • 245
  • 246
  • 247
  • 248
  • …
  • 493
  • Next Page »

Subscribe to Our Newsletter

AGL Logo

Get our eBook Now!

Candlestick - A Swing Traders Friend

We don’t spam! Read our privacy policy for more info.

You’ve been successfully subscribed to our newsletter!

Voted #1 at Stock Charts

SH Chart
Inverse S&P 500 Fund (SH) will have a Money Wave Buy today.

Help Us Help Animals

Help Us Help Animals

Recent Comments

  • DBC ETF Guide: Is This Commodity Fund Worth the Risk? on ETF Asset Allocation: Choosing the Right Mix for Your Portfolio
  • ATGL Weekly Money Flow - 2026-03-08 on ATGL Top Pick of the Week! Feb 22, 2026
  • XBI ETF Explained: Is This Biotech Fund a Smart Buy in 2026? on What Is an Expense Ratio and What Would Be a Good One?
  • XBI ETF Explained: Is This Biotech Fund a Smart Buy in 2026? on What Are Sector ETFs and How Do You Invest in Them?
  • XBI ETF Explained: Is This Biotech Fund a Smart Buy in 2026? on ETF vs Index Fund Comparison Guide for Smarter Investing

Become a Green Liner!

Help me make more Money in the Stock Market.

ON ATGL

  • DashBoard
  • Weekly Commentary
  • Daily Buy / Sell Signals
  • Day Trade Setup
  • Trading Rooms

Design & Develop By Pixelvect

STRATEGIES

  • Swing Trading
  • ATGL Pick of the Week
  • Dividend Growth
  • ETF Sector Rotation
  • Dogs of the Dow

HELP

  • ATGL Trading Rules
  • FAQ
  • Account Maintenance
  • Contact US
  • Join

FOLLOW US

Instagram Linkedin Twitter Facebook

© COPYRIGHT 2024 · ABOVETHEGREENLINE.COM · ALL RIGHTS RESERVED · PRIVACY · TERMS · CONTACT · WATCHLIST · CURRENT