
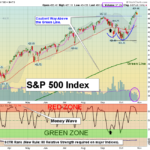
Markets were mixed today even though 80% of the Stocks have had higher than expected Earnings. But many of the Leaders are back up in the Red Zones (probably too late to Buy for the Short Term). The S&P 500 and DOW 30 Indices were able to stay … [Read more...]
Money Wave Alert! Oct 27, 2021
Money Wave Alert! Oct 26, 2021
Markets were slightly higher again today as the S&P 500 and DOW 30 Indices were able to stay above the September Highs. Earnings are coming out, with some stocks popping to the upside. The NASDAQ 100 and Small Caps are still lagging, and the … [Read more...]
Money Wave Alert! Oct 25, 2021
Markets were higher today as the S&P 500 and DOW 30 Indices were able to go slightly above the September Highs. The NASDAQ 100 and Small Caps are still lagging, and the Volume is Low. Normally you want to see very High Volume on a breakout above … [Read more...]
Money Wave Alert! Oct 22, 2021
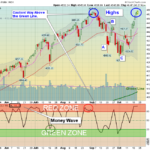
Markets were mixed today as the Indices are back up to the September Highs, which would normally be Resistance. Now the Indices must continue to make Higher Highs for the rally that began in March 2020 to continue. Many of the Leaders are back up in … [Read more...]
Money Wave Alert! Oct 21, 2021
Markets were mostly higher again today as the Indices are back up to the September Highs. Now the Indices must continue to make Higher Highs for the rally that began in March 2020 to continue. Normally there would be some Selling up here at the … [Read more...]
- « Previous Page
- 1
- …
- 235
- 236
- 237
- 238
- 239
- …
- 499
- Next Page »