Above the Green Line -01
  • Market Insights
        • Commentary
          • Daily
          • Weekly
        • BUY / SELL SIGNALS
          • Trade Posts
          • Recent Trade Alerts
          • Recent Day Trades
        • BLOGROLL
          • Dividend Growth Blog
          • ETF Sector Blog
          • Dow Dogs
          • TPOW Blog
  • Strategies
        • SWING TRADING
          • Current Positions
          • Watchlists
          • Closed Positions
          • Candidates - TOP 100
          • Specialty Stocks
        • WEEKLY STOCK PICK
          • TPOW Charts
          • TPOW Performance
          • TPOW Strategy Guide
          • TPOW Performance Dashboard
        • DAY TRADING
          • Watch List
        • ATGL DASHBOARD
        • ETF STRATEGIES
          • ETF Sector Rotation
          • ETF Sector Portfolio
        • DIVIDEND GROWTH
          • Dividend Growth Portfolio
          • Dividend Calendar
        • DOGS OF THE DOW
          • Dogs of the Dow Portfolio
          • DOW 5 Portfolio
  • Markets
        • US MARKET
          • Commodities
          • Energy
          • Precious Metals
          • Volatility
        • GLOBAL MARKETS
          • Market Indices
          • Economic Calendar
          • FOREX Heat Map
          • FOREX Cross Rates
          • Crypto Currency Market
  • Investing
    • Discord Community
    • Dashboard
  • Resources
        • ARTICLES
          • Dividend Growth Model Articles
          • ETF Articles
          • Investment Strategies Articles
          • Market and Economic Insights
          • Stock Trade Articles
          • Stock Reviews
        • TOOLS
          • Stock Scanners
          • Charting Software
          • Brokerage Firms
        • STOCK CHARTS
          • Key Components
          • Reading Charts
          • Drawing Stock Charts
          • Identifying Trends
        • RETIREMENT PLANNING
  • About
    • Contact Us
    • How to Win
    • #1 At Stockcharts
    • Disclaimer
    • FAQ
  • Log In
  • Subscribe

October 22, 2021

Money Wave Alert! Oct 22, 2021

XLK Chart
The Tech Fund (XLK) is back up to the Highs, but the Volume is Low.

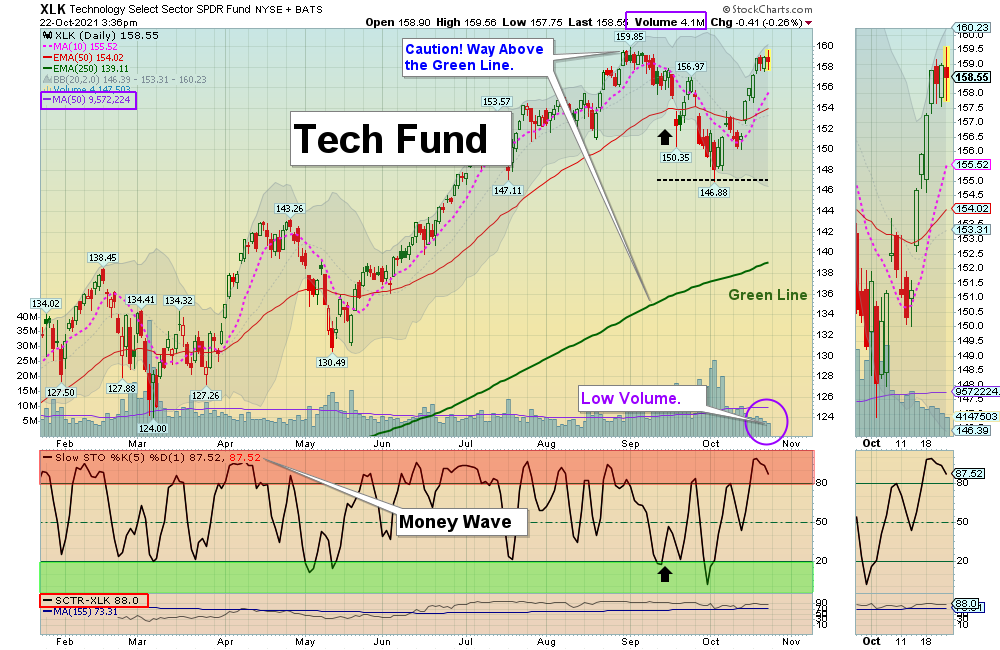
Markets were mixed today as the Indices are back up to the September Highs, which would normally be Resistance.  Now the Indices must continue to make Higher Highs for the rally that began in March 2020 to continue. Many of the Leaders are back up in the Red Zones (probably too late to Buy for the Short Term). Volume is very Low because Smart Money is not Buying at the Highs (we bought 2 weeks ago).

The Money Wave Buy Watch List below is very small, which normally means a Market pullback is coming.

New Investors:  Leaders are back up in the Red Zones. Please WAIT for the Leaders to correct back down into the Green Zones for more Money Wave Buys. It does not take that long. The better trades happen when the S&P 500 Index is in the Green Zone.  

Another slow day for Triple Buys: DATS (+33%) & ADMP (+5%). Should be some nice ones soon for AA AMC ANY BTBT BTU HUT HX M MARA & OCGN  in DAY TRADING SETUPS. 

Bonds  were up today, but are Below the Green Line.

Crude Oil was up $1.29 today at $83.79.

BUYS TODAY    10/22/2021     NONE TODAY  

_________________________________________________________________________________________________

JUMP START SCROLLING CHARTS: (Buy with High Volume.   

EVH      EVOLENT HEALTH INC.        Buy above the $30.90 with High Volume with a 5% Trailing Sell Stop Loss below it.   

INDA      INDIA FUND      Wait for Money Wave Close > 20 with High Volume. 

LPTX      LEAP THERA.     Wait for Money Wave Close > 20 with High Volume. 

_________________________________________________________________________________________________

WATCH LIST (Click here)       

WATCH LIST SCROLLING CHARTS (Real Time)

AA      ALCOA CORP.      Wait for Money Wave Close > 20 with High Volume. 

BTU      PEABODY ENERGY      Wait for Money Wave Close > 20 with High Volume.   

Please be patient and wait for Money Wave Buy Signals.  We will email you when they are ready. Follow on the WATCH LIST.      
Emotions are very high now, so please do not Buy unless you are VERY NIMBLE.

The Leaders are Way Above the Green Lines (all Investments eventually return to their Green Lines).      

____________________________________________________________________________________________________________

SELLS TODAY             

MOXC      MOXIAN INC.      EXIT if it is going to Close below Support of  $6.31.  This trade was not logged.

SNAP      SNAP INC.      EXIT if it is going to Close below your Buy Price, or  $73.41.  SNAP dumped today on Bad News, which is when we like to Buy. If you are stuck in it, SNAP will normally return near the Red Line (50-day avg.) when this Selling Climax is over. This trade was not logged.     

XLRE      REAL ESTATE FUND      The Target Hit at $47.50 for a 5.7 % Gain.

NEW:       MY TRADING DASHBOARD
DAY TRADING SETUPS
NEW:  TRADE ALERTS
ARE YOUR INVESTMENTS ABOVE THE GREEN LINE?
ETF SECTOR ROTATION SYSTEM   
New TOP 100 LIST Updated Oct 1, 2021

Many like to Buy the day before, near the Close, if the Money Wave is going to create a Buy Signal (Closing > 20 and out of the Green Zone).

Don’t Buy if the Investment has already popped up too much. Money Wave Buys are usually good for a 3-6 %  move in a few days.

We will “Not Log” trades if the Reward/Risk is not at least 2:1, or Low Volume. These have more risk.   


HAVE A NICE WEEKEND!

Related Post

– Money Wave Alert! Oct 21, 2021

Subscribe to Our Newsletter

AGL Logo

Get our eBook Now!

Candlestick - A Swing Traders Friend

We don’t spam! Read our privacy policy for more info.

You’ve been successfully subscribed to our newsletter!

Voted #1 at Stock Charts

SH Chart
Inverse S&P 500 Fund (SH) will have a Money Wave Buy today.

Help Us Help Animals

Help Us Help Animals

Recent Comments

  • Market Breadth Indicators: A Trader’s Guide to Early Trend Detection on Backtesting: Definition and How a Trading Strategy Backtest Works
  • Island Reversal Pattern: Definition and Formation Explained on Double Top Pattern: How to Identify and Trade This Reversal Signal
  • Channel Pattern Guide: What It Is and Why It Matters on A Guide to Forecasting Using Moving Averages
  • What Is a Broadening Bottom Chart Pattern? Full Guide on Bull vs. Bear Market: An Investor’s Guide to Market Phases
  • ATGL Weekly Money Flow - 2025-05-11 on ATGL Top Pick of the Week! Apr 6, 2025

Become a Green Liner!

Help me make more Money in the Stock Market.

ON ATGL

  • DashBoard
  • Weekly Commentary
  • Daily Buy / Sell Signals
  • Day Trade Setup
  • Trading Rooms

Design & Develop By Pixelvect

STRATEGIES

  • Swing Trading
  • ATGL Pick of the Week
  • Dividend Growth
  • ETF Sector Rotation
  • Dogs of the Dow

HELP

  • ATGL Trading Rules
  • FAQ
  • Account Maintenance
  • Contact US
  • Join

FOLLOW US

Instagram Linkedin Twitter Facebook

© COPYRIGHT 2024 · ABOVETHEGREENLINE.COM · ALL RIGHTS RESERVED · PRIVACY · TERMS · CONTACT · WATCHLIST · CURRENT