
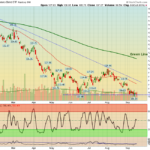
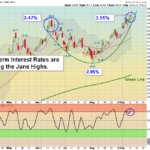
Long Term T-Bonds are Way Below the Green Line, and could be forming a "W" or Double Bottom pattern. The FED is putting on the brakes to slow down Inflation and the Economy. They do this by Tightening the supply of money (raising short term … [Read more...]
What does FED Tightening on Wed. mean for long term Interest Rates.
Money Wave Alert! Sep 16, 2022
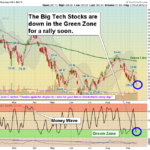
Markets were lower again today as the Indices are selling off and discounting the FED tightening by 3/4 % next Wednesday, Sept 21. The Indices are over-sold and back down in the Green Zones for Buy Signals soon. We will soon see if all of the FED … [Read more...]
Money Wave Alert! Sep 15, 2022
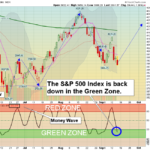
The S&P 500 Index is back down in the Green Zone for a Buy Signal soon. Markets were lower again today as the Indices are now over-sold and back down in the Green Zones. Not much Buying was coming in as many are waiting on the FED to tighten … [Read more...]
Money Wave Alert! Sep 14, 2022
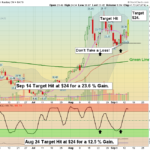
Markets were mixed to lower today after yesterday's big dump. Not much Buying was coming in as many are waiting on the FED to tighten more next Wednesday Sep 21, We will soon see if all of the FED tightening slows down the Economy and help Bonds … [Read more...]
Money Wave Alert! Sep 13, 2022
Markets were sharply lower today as the major Indices were back up in the Red Zones (probably too late to Buy for the short term). Inflation numbers were higher than expected so the US Dollar shot up once more. Now many are waiting on the FED to … [Read more...]
- « Previous Page
- 1
- …
- 180
- 181
- 182
- 183
- 184
- …
- 490
- Next Page »