Above the Green Line -01
  • Market Insights
        • Commentary
          • Daily
          • Weekly
        • BUY / SELL SIGNALS
          • Trade Posts
          • Recent Trade Alerts
          • Recent Day Trades
        • BLOGROLL
          • Dividend Growth Blog
          • ETF Sector Blog
          • Dow Dogs
          • TPOW Blog
  • Strategies
        • SWING TRADING
          • Current Positions
          • Watchlists
          • Closed Positions
          • Candidates - TOP 100
          • Specialty Stocks
        • WEEKLY STOCK PICK
          • TPOW Charts
          • TPOW Performance
          • TPOW Strategy Guide
          • TPOW Performance Dashboard
        • DAY TRADING
          • Watch List
        • ATGL DASHBOARD
        • ETF STRATEGIES
          • ETF Sector Rotation
          • ETF Sector Portfolio
        • DIVIDEND GROWTH
          • Dividend Growth Portfolio
          • Dividend Calendar
        • DOGS OF THE DOW
          • Dogs of the Dow Portfolio
          • DOW 5 Portfolio
  • Markets
        • US MARKET
          • Commodities
          • Energy
          • Precious Metals
          • Volatility
        • GLOBAL MARKETS
          • Market Indices
          • Economic Calendar
          • FOREX Heat Map
          • FOREX Cross Rates
          • Crypto Currency Market
  • Investing
    • Discord Community
    • Dashboard
  • Resources
        • ARTICLES
          • Dividend Growth Model Articles
          • ETF Articles
          • Investment Strategies Articles
          • Market and Economic Insights
          • Stock Trade Articles
          • Stock Reviews
        • TOOLS
          • Stock Scanners
          • Charting Software
          • Brokerage Firms
        • STOCK CHARTS
          • Key Components
          • Reading Charts
          • Drawing Stock Charts
          • Identifying Trends
        • RETIREMENT PLANNING
  • About
    • Contact Us
    • How to Win
    • #1 At Stockcharts
    • Disclaimer
    • FAQ
  • Log In
  • Subscribe

September 15, 2022

Money Wave Alert! Sep 15, 2022

SPX Chart

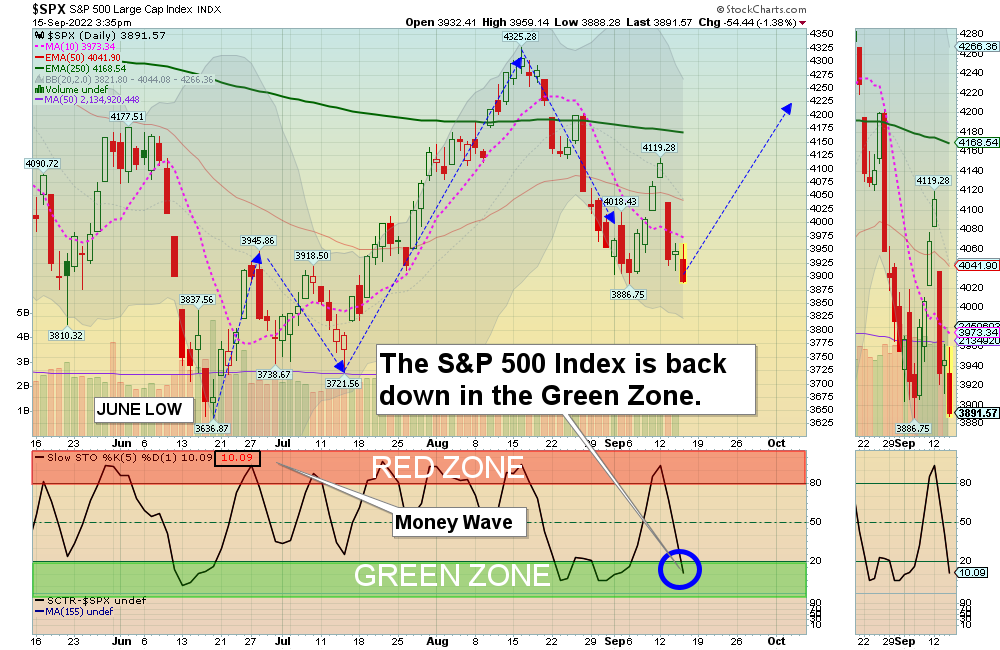
The S&P 500 Index is back down in the Green Zone for a Buy Signal soon.

Markets were lower again today as the Indices are now over-sold and back down in the Green Zones. Not much Buying was coming in as many are waiting on the FED to tighten more next Wednesday Sep 21, We will soon see if all of the FED tightening slows down the Economy and help Bonds return tothe Green Line. A Bond rally would mean lower long term Interest Rates, which the Tech Stocks need.

Please be patient and wait for Buy Signals for Investments that are still Above the Green Lines.  BUYS SOON – CHARTS  The best moves are when the S&P 500 Index is also coming up out of the Green Zone (very soon).  

_________________________________________________________________________________________________________________

BUYS TODAY   9/15/2022      

ESPR      ESPERION THERA.      Actually had a Buy Signal last night and was up 5%. ESPR  will not be Bought or Logged as the Volume is low today.   

We will “Not Log” trades if the Reward/Risk is not at least 2:1, or Low Volume. These have more risk. 

 
BUYS TOMORROW 

ARRY      ARRAY TECH      Wait for Money Wave Close > 20 with High Volume. 

PBR      PETROBAS ENERGY      Buy above $13.65 with High Volume with a 5% Trailing Sell Stop Loss below it.     

SIGA      SIGA TECH.     Buy above $14.48 with High Volume with a 5% Trailing Sell Stop Loss below it.      

Shop for a better price earlier in the day with Triple Buy Signal, on the same day that a Daily Money Wave Buy Signal will occur.  

BUYS SOON     

CAH      CARDINAL HEALTH      Wait for Money Wave Close > 20 with High Volume.     

MCK      MCKESSON CORP.      Wait for Money Wave Close > 20 with High Volume.   

Please be patient and Wait for Money Wave Buy Signals.  We will email you when they are ready. Follow on the WATCH LIST.   

SELLS TODAY  

ASTS      AST SPACEMOBILE      EXIT if it is going to Close below Support of $9.72.  This trade was not logged.

ICLN      GLOBAL CLEAN ENERGY FUND      EXIT if it is going to Close below the Pink Line around $22.41.     

PLUG      PLUG POWER      The Target was Hit at $30 for a 9.2% Gain. This trade was not logged.   

UNG      US NAT’L. GAS FUND      EXIT if it is going to Close below the Pink Line around $29.11. The Target was already Hit at $31 for a 6.9 % Gain. This trade was not logged.   

XLU      UTILITIES FUND      EXIT if it is going to Close below the Pink Line around $76.23. The Target was already Hit at $78 for a 4.6 % Gain.

__________________________________________________________________________________________________________

DAY TRADING SETUPS.  A few Triple Buy Pops today: BBBY (+5%) CCL (+5%) & TARK (+6%). ( Try out the New Side by Side layout.      

DAY TRADING FOR INDICES & LARGE CAPS CHARTS.

Bonds were down today and are Way Below the Green Line.  

Crude Oil was down $3.31 today at $85.17.

MY TRADING DASHBOARD 
SWING TRADING CURRENT POSITIONS
DAY TRADING SETUPS
TRADE ALERTS
GREEN LINE CHARTS AT STOCKCHARTS
ARE YOUR INVESTMENTS ABOVE THE GREEN LINE?
GREEN LINE RULES
ETF SECTOR ROTATION SYSTEM   
New TOP 100 LIST Updated Sep 1, 2022

Many like to Buy the Swing Trades just before the Close, if the Money Wave is going to create a Buy Signal (Closing > 20 and up out of the Green Zone). Don’t Buy if the Investment has already popped up too much. Money Wave Buy Signals are usually good for a 3-6 % move in a few days.

We will “Not Log” trades if the Reward/Risk is not at least 2:1, or Low Volume. These have more risk. 

Related Post

– ESPR

Subscribe to Our Newsletter

AGL Logo

Get our eBook Now!

Candlestick - A Swing Traders Friend

We don’t spam! Read our privacy policy for more info.

You’ve been successfully subscribed to our newsletter!

Voted #1 at Stock Charts

SH Chart
Inverse S&P 500 Fund (SH) will have a Money Wave Buy today.

Help Us Help Animals

Help Us Help Animals

Recent Comments

  • Market Breadth Indicators: A Trader’s Guide to Early Trend Detection on Backtesting: Definition and How a Trading Strategy Backtest Works
  • Island Reversal Pattern: Definition and Formation Explained on Double Top Pattern: How to Identify and Trade This Reversal Signal
  • Channel Pattern Guide: What It Is and Why It Matters on A Guide to Forecasting Using Moving Averages
  • What Is a Broadening Bottom Chart Pattern? Full Guide on Bull vs. Bear Market: An Investor’s Guide to Market Phases
  • ATGL Weekly Money Flow - 2025-05-11 on ATGL Top Pick of the Week! Apr 6, 2025

Become a Green Liner!

Help me make more Money in the Stock Market.

ON ATGL

  • DashBoard
  • Weekly Commentary
  • Daily Buy / Sell Signals
  • Day Trade Setup
  • Trading Rooms

Design & Develop By Pixelvect

STRATEGIES

  • Swing Trading
  • ATGL Pick of the Week
  • Dividend Growth
  • ETF Sector Rotation
  • Dogs of the Dow

HELP

  • ATGL Trading Rules
  • FAQ
  • Account Maintenance
  • Contact US
  • Join

FOLLOW US

Instagram Linkedin Twitter Facebook

© COPYRIGHT 2024 · ABOVETHEGREENLINE.COM · ALL RIGHTS RESERVED · PRIVACY · TERMS · CONTACT · WATCHLIST · CURRENT