Above The Green Line

  • Commentary
    • BUY / SELL SIGNALS
      • Trade Alerts
    • DIVGRO BLOG
    • ETF SECTOR BLOG
    • DOW DOGS BLOG
    • NEWS
    • STOCK IDEAS
  • Strategies
    • SWING TRADING
      • CURRENT POSITIONS
      • WATCHLISTS
      • CLOSED POSITIONS
      • CANDIDATES – TOP 100
      • SPECIALTY STOCKS
    • DAY TRADING
      • Watch List
    • DIVIDEND GROWTH
      • Dividend Growth Portfolio
      • Dividend Calendar
    • DOGS OF THE DOW
      • Dogs of the Dow Portfolio
      • DOW 5 Portfolio
    • ETF SECTOR ROTATION
      • ETF Sector Portfolio
  • Markets
    • US MARKET
      • Commodities
      • Energy
      • Precious Metals
      • Volatility
    • GLOBAL MARKETS
      • MARKET INDICES
      • ECONOMIC CALENDAR
      • FOREX HEAT MAP
      • FOREX CROSS RATES
      • CRYPTOCURRENCY MARKET
    • DASHBOARD
    • IDEAS
  • Investing
    • FORUM
    • DISCORD COMMUNITY
  • Resources
    • ARTICLES
    • TOOLS
      • STOCK SCANNERS
      • CHARTING SOFTWARE
      • BROKERAGE FIRMS
    • WEEKLY STOCK
    • RETIREMENT PLANNING
    • BLOGROLL
    • FAQ
  • About
    • CONTACT US
    • HOW TO WIN
    • #1 AT STOCKCHARTS
    • DISCLAIMER
  • Log In
  • Subscribe

September 17, 2022

What does FED Tightening on Wed. mean for long term Interest Rates.

TLT Chart

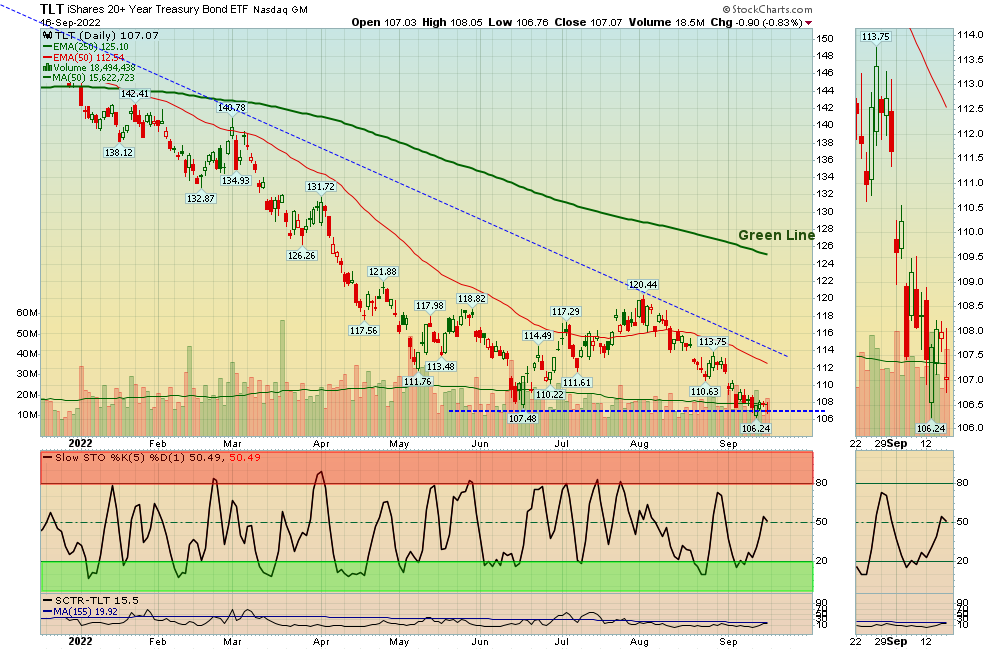
Long Term T-Bonds are Way Below the Green Line, and could be forming a “W” or Double Bottom pattern.

The FED is putting on the brakes to slow down Inflation and the Economy. They do this by Tightening the supply of money (raising short term Interest Rates).

But long term T-Bonds LOVE a weak Economy and lower Inflation, so investor demand of Bonds should increase (and the yield on T-Bonds should drop).

The FED only controls short term Rates and many investors don’t understand that FED Tightening is usually Bullish for long term T-Bonds.

Since we know that Bonds will eventually return near the Green Line, some investors will bet on a Double Bottom or “W” pattern of the TLT Bond Fund below, with a Sell Stop below $106.

But buying investments Below the Green Line have more risk, and are generally slower, so we will WAIT for TBT (Inverse Bonds) to correct and Buy them again.

Posted By AbovetheGreenLine at 7:12 pm Leave a Comment Tagged With: premium

Leave a Reply Cancel reply

You must be logged in to post a comment.

Voted #1 at Stock Charts

SH Chart
Inverse S&P 500 Fund (SH) will have a Money Wave Buy today.

Help Us Help Animals

Help Us Help Animals

Recent Comments

  • Green Line Weekly Sep 3, 2023 – Omni Legal on Green Line Weekly Sep 3, 2023
  • AbovetheGreenLine on Green Line Weekly Aug 27, 2023
  • lbrodt on Green Line Weekly Aug 27, 2023
  • Mitch Van Zelfden on Money Wave Alert! Jul 31, 2023
  • AbovetheGreenLine on Money Wave Alert! Jul 31, 2023

Become a Green Liner!

Help me make more Money in the Stock Market.

Above the Green Line

ON ATGL

  • Weekly Commentary
  • Intraday Buy / Sells
  • Day Trade Setup
  • Trading Rooms

STRATEGIES

  • Swing Trading
  • Dividend Growth
  • ETF Sector Rotation
  • Dogs of the Dow

HELP

  • ATGL Trading Rules
  • FAQ
  • Account Maintenance
  • Contact US
  • Join

© Copyright 2023 · AboveTheGreenLine.com · All Rights Reserved · Privacy · Terms · Contact · WatchList · Current