

Apr 13, 2025.
For busy investors that don’t have time to Swing Trade, we now have a simple Strategy:
Top Pick of the Week. You Buy the “Pick” on Monday morning, and then Sell on Friday’s Close. It’s a time-efficient approach designed to capture short-term gains without requiring constant market monitoring.
This “Pick” is emailed to you with this Weekly Commentary (more details here).
The Top Pick of the Week: GILEAD SCIENCES GILD Buy on the Open on Monday, and Sell on the Close Friday.
The 25 Top Picks of the Week Trades were up 15.79 % before compounding, and the S&P 500 Fund (SPY) is down -6.5 %.
You can view the current Weekly Stock Performance.
______________________________________________________________________________
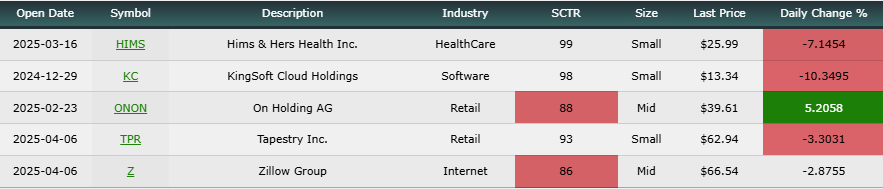
DAILY SWING TRADING (SHORT TERM)Watch List and Charts to Buy Soon.
| Daily Swing Watch List to Buy | Daily Swing Charts to Buy |
| Current Daily Swing Positions | Current Swing Charts |
| Closed Daily Swing Results | Trading Dashboard |
4/13/2025 Markets were sharply higher for the week, as the Indices and Momentum stocks finally bounced up from the FEAR Flush. The Media has many investors concerned that a slowdown is coming. But the Weekly indicators and high FEAR levels say that there there is a high probability of a larger bounce up soon.
Stocks were extremely oversold on a weekly chart, and you can see on the S&P 500 chart above that it is trying to move up out of the Green Zone. Smart Money took Profits in the Red Zone, and are Buying back down here. Many are very frustrated now as it has been harder to make money lately. Remember that investing requires Discipline to wait out these emotional FEAR Flushes, and that the Strongest Leaders will normally go back up to retest their recent highs. This has been a larger than normal correction to take the FOMO out of the Markets.
Alert! Market Risk is Low (GREEN). The probability of successful Short Term Trades is better, when the % of stocks above the 50-day avg. is below 20 (LIKE NOW).
We Buy the strongest Leaders that make new highs, on pull-backs. So follow the Green Line System and you should continue to win more than you lose. SEE WATCH LIST
With the Green Line System, your Money should flow into the Strongest areas and your Account value should be able to grow in both Bull and Bear Markets. Follow the MONEY, not the MEDIA.
______________________________________________________________________________
For the week the Dow was up 4.88%, the S&P 500 was up 4.67% and the NASDAQ 100 was up 7.51%. The major Indices still have a Relative Strength below 80, so you should currently own the stronger Funds here.
The Inflation Index (CRB) was up 0.68% the week and is Below the Green Line, indicating Economic Contraction.
Bonds were down 6.64% for the week, and are Below the Green Line, indicating Economic Expansion.
The US DOLLAR was down 0.17% for the week.
Crude Oil was down 0.79% for the week at $61.50 and GOLD was up 6.67% at $3236.55, a new high.
_______________________________________________________________________
DAY TRADERS: We are doing many profitable Day Trades on our Discord Trading Hub (free). Please join Discord or X (Twitter) with your cell phone app for the fastest Trade Alerts and Daily email notifications during the day. Other methods of notification have been too slow. Also, please check our our Live Trading Room on YouTube during Market hours.
_______________________________________________________________________
SWING TRADE COMPLETED TRADES:
IAU GOLD Fund Target was Hit with a 1.2% Gain.
QBTS D-WAVE QUANTUM Sold by email for 11.4 % Gain.
We are now in 5 Three Star logged Swing Trading Positions for the Short Term. There is only 1 investment on the Short Term Watch List.
Completed Swing Trades thru Feb 2025: 53 Trades, + 160.94% Total. Avg. Trade = 3.04 % Gain (before taxes and commissions).
______________________________________________________________________________
LONG TERM WATCH LIST
ATGL Long Term Weekly Watchlist- Click here for scrolling charts.
Completed Long Term Trades in 2024: 51 Trades, +333.46% Total, or 9.6 % / Trade (before taxes & commissions).
______________________________________________________________________________
Important Links| Top 100 | Stage Chart Investing | CNN Fear & Greed Index |
| Dividend Growth Portfolio | ETF Sector Portfolio | Dogs of the Dow |
| Long Term Strategy | Stage Chart Investing | Articles |
Alert! Market Risk is Low (GREEN). The probability of successful Short Term Trades is better, when the % of stocks above the 50-day avg. is below 20.
Tell your Friends about the Green Line, and Help Animals.
______________________________________________________________________________
QUESTION: John C. writes “Hi. I have been using your methods with quite good success over the past year, but lately I have been wondering something. Sometimes you post a daily chart for a company, but other times you post a weekly chart. For swing/momentum trading, which chart is best to go by, because looking at both, side to side, the Money Waves are quite different.
Many thanks, John C.
ANSWER: Hi John. The Green Line System is based on Buying the Leaders in the Green Zone, and taking Profits in the Red Zone.
The Daily Chart cycle usually takes 1-3 weeks and the Weekly Chart takes 1-3 months. If you Buy the Weekly, don’t look at the Daily, as the Daily will cycle thru many times and be confusing. Pick only 1 Time Frame, and stick with it.
Many will use a shorter term Time Frame for ENTRY only, then go back to your Main Chart decision.
Thanks for writing.
ATGL


