
For busy investors that don’t have time to Swing Trade, we now have a simple Strategy:
Top Pick of the Week. You Buy the “Pick” on Monday morning, and then Sell on Friday’s Close. It’s a time-efficient approach designed to capture short-term gains without requiring constant market monitoring.
This “Pick” is emailed to you with this Weekly Commentary (see below & more details here).
The Top Pick of the Week is still: Intel Corp. $INTC was still down last week so we will try one more week for a bounce up, and will Sell on the Close this Friday. Not many candidates to choose from now with the S&P on highs.
You can view the current Weekly Stock Performance.
______________________________________________________________________________
DAILY SWING TRADING (SHORT TERM)Watch List and Charts to Buy Soon.
| Daily Swing Watch List to Buy | Daily Swing Charts to Buy |
| Current Daily Swing Positions | Current Swing Charts |
| Closed Daily Swing Results | Trading Dashboard |
12/28/2025 Markets were higher for the week after the Indices and Leaders bounced up out of the Green Zones (probably too late to Sell for the short term) and retested the recent Highs. Markets should hold up again next week for Money Manager’s Bonuses… Gold & Silver blew out on Inflation Fears. Volume has been very low from the Holidays.
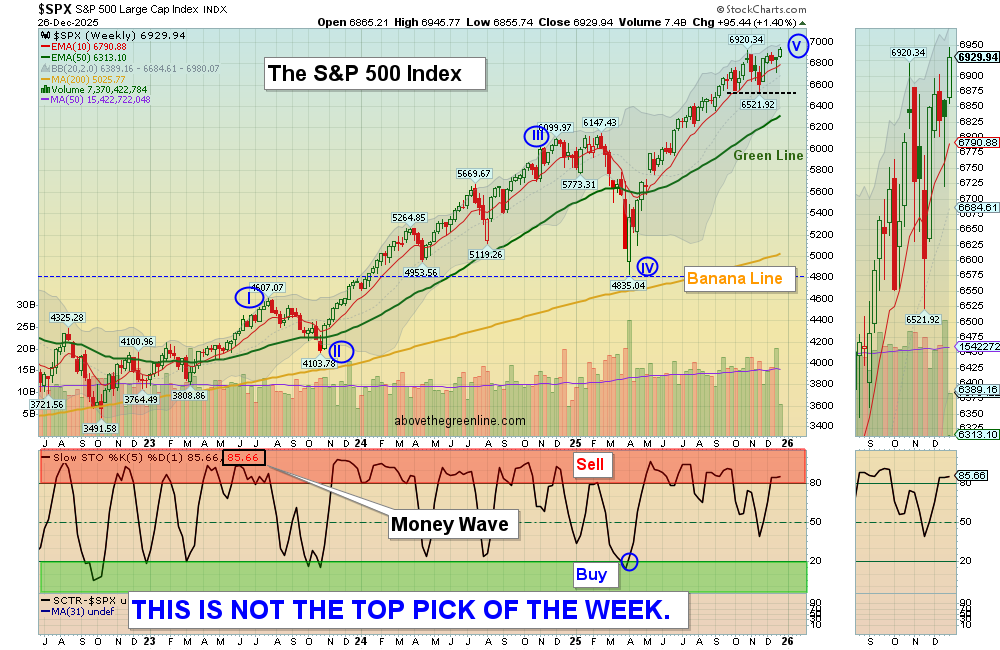
This week the S&P 500 and NYSE made higher highs, but the DOW 30, MAG 7, Small Caps, & QQQ did not.
The major Indices must make higher highs soon for this huge rally from the April lows to continue. Otherwise this could be a Double Top (M pattern) and a Sell signal for many Technical Analysts.
We Buy the strongest Leaders that make new highs, on pull-backs. So follow the Green Line System and you should continue to win more than you lose. SEE WATCH LIST
With the Green Line System, your Money should flow into the Strongest areas and your Account value should be able to grow in both Bull and Bear Markets. Follow the MONEY, not the MEDIA.
______________________________________________________________________________
For the week the Dow was up 1.22%, the S&P 500 was up 1.40% and the NASDAQ 100 was up 1.24%. The major Indices still have a Relative Strength below 80, so you should currently own the stronger Funds here.
The Inflation Index (CRB) was up 1.81% this week and is Above the Green Line, indicating Economic Expansion.
Bonds were up 0.22% for the week, and are Above the Green Line, indicating Economic Contraction.
The US DOLLAR was down 0.55% for the week.
Crude Oil was up 0.67 % for the week at $56.90 and GOLD was up 4.37% at $4532.52.
_______________________________________________________________________
DAY TRADERS: We are doing many profitable Day Trades at our Live Trading Room on YouTube during Market hours. Please join Discord or X (Twitter) with your cell phone app for the fastest Trade Alerts and Daily email notifications during the day. Other methods of notification have been too slow.
_______________________________________________________________________
COMPLETED DAILY SWING TRADE TRADES:
IWM Small Cap Fund Target was Hit at $255 with a 1.7% Gain.
SOFI Sofi Tech. Stopped Out even.
We are now in 2 Three Star logged Swing Trading Positions for the Short Term. There are 3 investments on the Short Term Watch List.
Completed Swing Trades thru Nov 2025: 231 Trades, or 3.2% Avg. / Trade (before taxes and commissions).
______________________________________________________________________________
WEEKLY SWING TRADES – WATCH LIST
| Open Date | Symbol | Description | Industry | SCTR | Size | Last Price | Daily Change % | ATGL 60 Min | Comments | id | Strategy | Position | Sell Date | Sell Price | Purchase Price | Net Profit | Realized Gain/Loss % | ATGL Rule | Stop Loss | color | Chart | Update Date | Status | Unrealized Gain/Loss % | Volume | Post Type | # Shares | Amount Invested | Portfolio Weight | Dividend Rate | Current Yield | Current Value | Yield on Cost | Projected Annual Dividends | Total Dividends Received | Pay Back | Profit / Loss | Annualized Profit/Loss | Star Rating | Target Price | News Alert % | Target Triggered |
|---|---|---|---|---|---|---|---|---|---|---|---|---|---|---|---|---|---|---|---|---|---|---|---|---|---|---|---|---|---|---|---|---|---|---|---|---|---|---|---|---|---|---|
| 2026-06-17 | USO | US Oil Fund | Energy | 92 | ETF | $114.28 | -0.5136 | Wait for next Weekly Money Wave Close > 20 with High Volume. | 5092 | Long Term | Long | $0.00 | 0.00% | https://stockcharts.com/sc3/ui/?s=USO&a=2293225295&p=W&yr=1&mn=6&dy=0&id=p78387113253 | 2026-06-18 15:54:20 | open | 0.00% | 0 | Watch List | $0 | 0.00% | 0.00 | 0 | $0 | 0.00% | $0 | $0 | 0.00% | 0.00% | - | $135.00 | |||||||||||
| 2026-06-07 | SLV | Silver Fund | Metals | 93 | ETF | $59.05 | -0.773 | Wait for next Weekly Money Wave Close > 20 with High Volume. | 5083 | Long Term | Long | $0.00 | 0.00% | https://stockcharts.com/sc3/ui/?s=SLV&a=2284537971&p=W&yr=1&mn=6&dy=0&id=p52385594523 | 2026-06-08 19:47:29 | open | 0.00% | 0 | Watch List | $0 | 0.00% | 0.00 | 0 | $0 | 0.00% | $0 | $0 | 0.00% | 0.00% | - | $80.00 | |||||||||||
| 2026-05-26 | CTMX | Cytomx Thera. | HealthCare | 83 | Small | $2.96 | 0.1695 | Wait for next Weekly Money Wave Close > 20 with High Volume. | 5071 | Long Term | Long | $0.00 | 0.00% | https://stockcharts.com/sc3/ui/?s=CTMX&a=2273899296&p=W&yr=1&mn=0&dy=0&id=p89336138870 | 2026-05-26 19:08:23 | open | 0.00% | 0 | Watch List | $0 | 0.00% | 0.00 | 0 | $0 | 0.00% | $0 | $0 | 0.00% | 0.00% | - | $5.50 |
Weekly Green Zone Pops – Click here for scrolling charts.
WEEKLY SWING TRADES
RCL Royal Caribbean Sold at $295 via Trade Alert for a Loss.
Completed Weekly Swing Trades thru Nov 2025: 41 Trades, or 16.3 % / Trade (before taxes & commissions).
______________________________________________________________________________
Important Links| Top 100 | Stage Chart Investing | CNN Fear & Greed Index |
| Dividend Growth Portfolio | ETF Sector Portfolio | Dogs of the Dow |
| Long Term Strategy | Stage Chart Investing | Articles |
Alert! Market Risk is Medium (Yellow). The probability of successful Short Term Trades is better, when the % of stocks above the 50-day avg. is below 20.
Tell your Friends about the Green Line, and Help Animals.
______________________________________________________________________________
QUESTION: Jerry S. writes “How do I know when to Sell?”
ANSWER: Hi Jerry. Please follow the Rules for Selling below based on the Time Frame that you want to be in the Investment:
- Short Term: Sell when it Closes below the Pink Line (10-day avg.)
- Medium Term: Sell when it Closes below the Red Line (50-day avg.)
- Long Term: Sell when it Closes below the Green Line (250-day avg).
Or Follow the Current Positions (please click)on your daily emails.
Good trading, and tell your friends!
ATGL
