By ATGL
Updated July 6, 2025
When stock market turbulence strikes, and investor emotions fluctuate like a roller coaster, market volatility becomes a pressing concern. Traders and analysts often turn to the VIX, a leading indicator, to gauge this volatility and guide their strategies. Understanding its movements can provide crucial insights into market trends and potential opportunities.
Market volatility and investor sentiment are essential components of financial markets, influencing decisions and investment strategies. The VIX, although not needing a detailed definition here, plays a significant role as a predictive tool in these dynamic environments. Its calculations and readings offer a window into the underlying expectations and fears of market players.
This article delves into the intricate workings of the VIX, from its calculation inputs to its real-time applications. We will explore how traders interpret its signals, its implications during market fluctuations, and strategies for utilizing it effectively, while shedding light on common pitfalls in its deployment.
What Is the VIX Index and Why Does It Matter?
Market volatility can cause anxiety among investors. It reflects changes in stock prices due to uncertainty. A key tool traders use is the VIX, or Volatility Index. Often called “the fear index,” it shows how much volatility investors expect in the S&P 500 over the next 30 days.
What is the VIX Index?
- Nickname: The Fear Index
- Measures: Expected market volatility
- Reflects: Investor sentiment and market risk
The VIX is calculated using option prices listed on the Chicago Board Options Exchange. It combines the price of call and put options to signal future market swings. Traders watch it for clues about market expectations.
What Does the VIX Tell You?
- High VIX: Signals potential market turmoil and higher risk.
- Low VIX: Suggests steady market conditions.
During events like the COVID-19 pandemic or the Global Financial Crisis, the VIX often spikes. This spike indicates that investors anticipate more turbulence. By understanding the VIX, traders can better manage investment strategies and prepare for market changes. For a historical perspective, you can explore our detailed Fear Index list and charts to see how VIX levels have reacted during past periods of market stress.
Understanding How the VIX Measures Volatility
The VIX Index is a key metric in assessing market volatility. It is closely tied to the S&P 500, the primary index of 500 major companies. Unlike stock prices that reflect current market performance, the VIX reflects future expectations. It captures expected 30-day volatility, giving investors a clue about upcoming market behavior. The VIX is based on prices of options traded on the Chicago Board Options Exchange, more specifically, those on the S&P 500 Index. The US stock market’s volatility is often analyzed through the lens of the VIX, as it provides a clear signal of how much movement investors anticipate.Understanding how this index works helps investors make informed decisions during periods of economic uncertainty.
Inputs That Influence The VIX
Several factors influence the VIX, each playing a unique role in determining its value. Option premiums are the first critical factor. These premiums are what traders pay to buy or sell options on the S&P 500. Higher premiums usually mean traders expect more significant market movements, pushing the VIX higher.
Market expectations are also central. When investors predict increased volatility, they adjust how much they’re willing to pay for options. This sentiment is reflected in the VIX value, painting a picture of market sentiment and perceived risk.
Additionally, the time to expiration of these options impacts the VIX. Options with different maturity dates contribute to VIX calculations to show expected volatility over the next 30 days. Short-term fluctuations in the S&P 500 can lead to rapid changes in the VIX. Understanding how these inputs interact helps demystify the VIX and its role in predicting market behavior.
Interpreting High vs. Low VIX Readings
Market volatility often mirrors investor sentiment and expectations about future risks. The VIX, also known as the Fear Index, offers insights into market volatility. Here’s how you can interpret different VIX levels:
VIX Interpretations
| VIX Level | Market Sentiment | Future Market Expectations |
| Below 15 | Calm and Optimistic | Stable market conditions anticipated |
| 15 – 20 | Moderate Concern | Potential for mild to moderate swings |
| Above 20 | Elevated Anxiety | Likely increased market fluctuations |
High VIX levels signal heightened market fear or anxiety. Investors expect larger price swings and increased risk. On the contrary, low VIX readings suggest stability, with investors predicting a relatively calm market.
FAQs
How much VIX is good?
VIX under 20 is generally seen as stable, indicating positive investor sentiment and fewer expectations of dramatic market changes. A level above 20 suggests caution as market anxiety grows.
Traders and analysts watch the VIX closely. It helps them gauge when to adjust investment strategies to ride out market turbulence or capitalize on calmer times. Understanding VIX levels is crucial in the world of stock market volatility.
How Traders Use the VIX in Real-Time
The Volatility Index, or VIX, is a crucial tool for traders. It offers insight into the perceived risk in stock market trades. By understanding VIX movements, traders can make informed decisions on when to enter or exit the market. Let’s explore how this index signals opportunities and alerts traders to adjust their strategies.
Market Timing And Risk Signals
Market timing and risk assessment are critical components of successful trading. The VIX aids traders in these areas by acting as a barometer for potential market swings. When VIX readings rise, they signal increased market uncertainty. Traders often interpret these signals as an indication to prepare for potential downturns or recoveries.
A high VIX suggests that traders expect significant movement in the market. This expectation can stem from upcoming events or broader economic conditions. As a result, traders may adjust their strategies to manage risk, such as using options to hedge against possible losses. Conversely, a low VIX reading points to a stable market, suggesting less risk involved in current trades.
The VIX can also complement other technical indicators to generate buying and selling signals. For instance, a spike in the VIX alongside a major support level may reinforce a potential buying opportunity, while a sudden drop in volatility might suggest profit-taking conditions.
The real-time application of the VIX is crucial in volatile markets. Quick adjustments based on VIX trends can protect investments from sudden downturns. For instance, during times of crisis, like the COVID-19 pandemic, VIX readings provided critical insights into market behavior. Traders used these insights to decide whether to hold onto their positions or exit the market to minimize losses.
To stay better prepared, many traders also maintain a volatility watchlist —a curated set of assets or sectors that tend to respond sharply to changes in the VIX. Monitoring this list can help traders act quickly when volatility spikes.
Understanding how to interpret and apply the VIX can significantly enhance trading performance. By aligning trades with VIX signals, traders can navigate the complexities of market timing and risk management more effectively. This enhances their ability to capitalize on opportunities while guarding against potential pitfalls.
Can a High VIX Signal a Buying Opportunity?
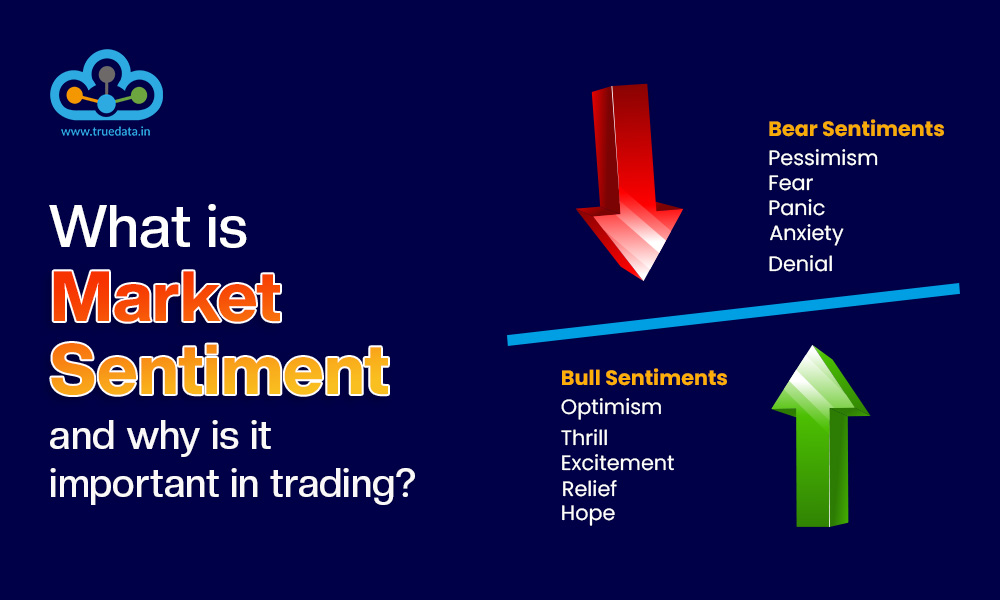
Market volatility reflects how much and how quickly market prices change. Investor sentiment plays a huge role. One key tool to gauge this is the VIX, known as the “Fear Index.” When the VIX is high, it signals increased uncertainty and anxiety among investors.
Panic often occurs right before market bottoms. This has been seen in events like the COVID-19 crash in March 2020 and the Global Financial Crisis in 2008. Both times, a spike in the VIX was followed by market recovery.
When the VIX is high, it can be tempting to buy stocks. The idea is that heightened fear may lead to undervalued stocks. However, this is risky if misunderstood.
Benefits of Buying During High VIX:
- Potential for Bargains: Stocks may be undervalued.
- Market Recovery: History shows markets tend to bounce back.
Risks:
- False Bottoms: The market may continue to fall.
- Emotional Decisions: High emotions can skew judgment.
Frequently Asked Question:
When the VIX is high, is it time to buy?
It can be, but caution is key. Thorough research and a clear strategy are essential. Always consider your risk tolerance and financial situation before making decisions.
Strategies for Trading the VIX
Trading the VIX is all about understanding market volatility and investor sentiment. The VIX, often referred to as the “Fear Index,” provides insights into market expectations. Traders use it to anticipate market swings and adjust their strategies accordingly.
Here are some strategies for trading the VIX:
- VIX Options: Traders can buy call or put options on the VIX to capitalize on expected movements.
- VIX Futures: Engage in VIX futures contracts to speculate on future volatility levels.
- Exchange-Traded Products (ETPs): Invest in ETPs that track the VIX for a more accessible approach to volatility trading.
- Hedging: Use the VIX to hedge against potential market risk and protect existing portfolios.
For traders seeking to profit when volatility declines, an inverse VIX strategy may be considered, using exchange-traded products designed to move opposite to the VIX.
It’s important to note that the VIX is not directly tradeable, but these instruments allow market participants to act on their market sentiment and expectations. Understanding how the VIX correlates with events like the COVID-19 pandemic or interest rate changes is crucial to exploiting market turbulence for potential gains.
By monitoring the VIX, traders and analysts can better navigate through market turmoil and refine their investment strategies.
Common Mistakes When Using the VIX
When using the VIX, or Volatility Index, investors often make common mistakes. First, traders might misinterpret the VIX as a direct measure of future stock movements. The VIX reflects market sentiment, not specific forecasts.
Another mistake is overlooking the time frame. The VIX indicates a 30-day outlook on volatility. It isn’t useful for predicting long-term trends.
Investors sometimes forget that the VIX is influenced by the options market rather than stock prices alone. This can skew realistic market expectations.
A fourth error involves failing to consider the context, such as economic events or geopolitical tensions that impact market volatility. The VIX spikes during periods of uncertainty, like the Global Financial Crisis or the COVID-19 pandemic, signaling market turbulence.
Lastly, traders might neglect to use the VIX alongside other indicators. Relying solely on the VIX can lead to incomplete analysis.
Mistakes with VIX:
- Misinterpreting as a stock forecast
- Ignoring its 30-day outlook
- Overlooking options market influence
- Neglecting economic context
- Relying only on the VIX without other indicators
By avoiding these pitfalls, traders can better gauge market risk and investor sentiment.
How to Use the VIX to Strengthen Your Strategy
Understanding the Volatility Index, or VIX, can be a game-changer for traders and investors. This index is an essential tool that signals future market conditions based on investor sentiment and expected fluctuations. Often referred to as the “Fear Index,” the VIX helps gauge market risk and stock market volatility.
Here’s how you can use the VIX to boost your investment strategies:
- Identify Market Trends: A rising VIX usually signals increasing fear or risk, suggesting a potential market downturn. Conversely, a declining VIX may indicate stability.
- Diversify Portfolios: Use insights from the VIX to adjust your portfolio. Consider adding safer assets when the VIX is high to mitigate risk.
- Leverage Options: Investors can use VIX options and futures to capitalize on anticipated volatility increases.
Here’s a breakdown of how the VIX functions:
| Factor | Impact on VIX |
| High investor fear | VIX up |
| Low investor fear | VIX down |
Equipped with this knowledge, you can make informed decisions and minimize market turbulence impacts. Start using the VIX to refine your strategies today to stay ahead in fluctuating markets! Join Above the Green Line to access expert insights, live trade alerts, and tools that help you navigate volatility with confidence.


[…] Implied Volatility (IV) quantifies the market’s expectation for future price movement. It is not backward-looking. Instead, it derives from current option prices and reveals how volatile the market expects the underlying asset to be. Broader market volatility trends can also be monitored using benchmarks like the VIX Volatility Index. […]