
Apr 20, 2025.
For busy investors that don’t have time to Swing Trade, we now have a simple Strategy:
Top Pick of the Week. You Buy the “Pick” on Monday morning, and then Sell on Friday’s Close. It’s a time-efficient approach designed to capture short-term gains without requiring constant market monitoring.
This “Pick” is emailed to you with this Weekly Commentary (more details here).
The Top Pick of the Week: DOXIMITY INC. DOCS Buy on the Open on Monday, and Sell on the Close Friday.
The 26 Top Picks of the Week Trades were up 16.32 % before compounding, and the S&P 500 Fund (SPY) is down -7.9 %.
You can view the current Weekly Stock Performance.
______________________________________________________________________________
DAILY SWING TRADING (SHORT TERM)Watch List and Charts to Buy Soon.
| Daily Swing Watch List to Buy | Daily Swing Charts to Buy |
| Current Daily Swing Positions | Current Swing Charts |
| Closed Daily Swing Results | Trading Dashboard |
4/20/2025 Markets were mostly lower for the week, as the Indices and Momentum stocks rallied up to the Red Zones (probably too late to Buy for the Short Term). The S&P 500 now needs a W pattern or Double Bottom on the DAILY chart to be Bullish. Most of the Buying on the recent lows was Short Sellers buying to take profits, and Bottom Fishers. Smart Money waits for a Double Bottom or higher low to Tell Us that Sellers have dried up.
The FEAR Index $VIX is back down in the Green Zone and should Pop up this week. The Media still has many investors concerned that a slowdown is coming. But the Weekly indicators and high FEAR levels say that there there is a high probability of a larger bounce up soon after a W pattern or higher low.
Many are very frustrated now as it has been harder to make money lately. Remember that investing requires Discipline to wait out these emotional FEAR Flushes, and that the Strongest Leaders will normally go back up to retest their recent highs. This has been a larger than normal correction to take the FOMO out of the Markets.
Alert! Market Risk is Low (GREEN). The probability of successful Short Term Trades is better, when the % of stocks above the 50-day avg. is below 20 (LIKE NOW).
We Buy the strongest Leaders that make new highs, on pull-backs. So follow the Green Line System and you should continue to win more than you lose. SEE WATCH LIST
With the Green Line System, your Money should flow into the Strongest areas and your Account value should be able to grow in both Bull and Bear Markets. Follow the MONEY, not the MEDIA.
______________________________________________________________________________
For the week the Dow was down 2.58%, the S&P 500 was down -1.41% and the NASDAQ 100 was down -2.27%. The major Indices still have a Relative Strength below 80, so you should currently own the stronger Funds here.
The Inflation Index (CRB) was up 2.05% the week and is Above the Green Line, indicating Economic Expansion.
Bonds were up 0.74% for the week, and are Below the Green Line, indicating Economic Expansion.
The US DOLLAR was down 0.53% for the week.
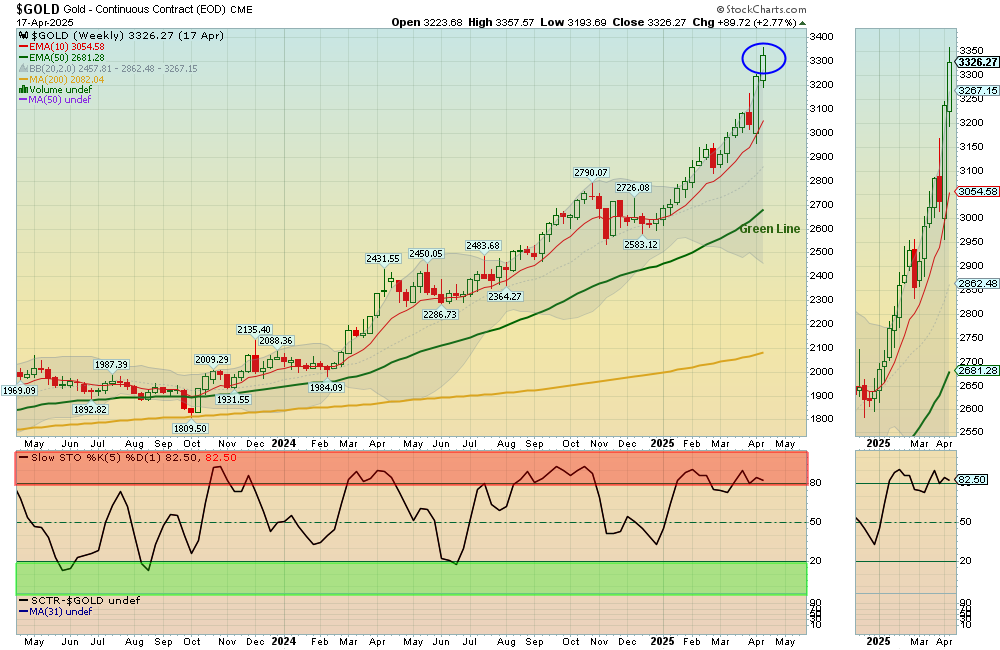
Crude Oil was up 5.17% for the week at $64.68 and GOLD was up 2.27% at $3326.27, a new high.
_______________________________________________________________________
DAY TRADERS: We are doing many profitable Day Trades on our Discord Trading Hub (free). Please join Discord or X (Twitter) with your cell phone app for the fastest Trade Alerts and Daily email notifications during the day. Other methods of notification have been too slow. Also, please check our our Live Trading Room on YouTube during Market hours.
_______________________________________________________________________
SWING TRADE COMPLETED TRADES:
EXC EXCELON CORP. Target was Hit at $47.50 with a 5.3% Gain.
LYC LLOYDS GROUP Target was Hit at $3.70 for a 5.4 % Gain,(Buy adjusted for $0.10 Dividend).
We are now in 5 Three Star logged Swing Trading Positions for the Short Term. There are 3 investments on the Short Term Watch List.
Completed Swing Trades thru Feb 2025: 53 Trades, + 160.94% Total. Avg. Trade = 3.04 % Gain (before taxes and commissions).
______________________________________________________________________________
LONG TERM WATCH LIST
ATGL Long Term Weekly Watchlist- Click here for scrolling charts.
ADMA ADMA BIOLOGICS Target was Hit at $21 with a 32 % Gain.
Completed Long Term Trades in 2024: 51 Trades, +333.46% Total, or 9.6 % / Trade (before taxes & commissions).
______________________________________________________________________________
Important Links| Top 100 | Stage Chart Investing | CNN Fear & Greed Index |
| Dividend Growth Portfolio | ETF Sector Portfolio | Dogs of the Dow |
| Long Term Strategy | Stage Chart Investing | Articles |
Alert! Market Risk is Low (GREEN). The probability of successful Short Term Trades is better, when the % of stocks above the 50-day avg. is below 20.
Tell your Friends about the Green Line, and Help Animals.
______________________________________________________________________________
QUESTION: Jose M writes “Morning, I seem to have difficulties on finding the Money Wave chart on the ETFs. Thanks.”
ANSWER: The Charts and Money Waves can be pulled up by clicking on the Symbol of the Investment on the Watch List or Current Positions links in every Daily email.
The Money Wave is the Red and Green Zone on the bottom part of the Chart. Buy when the Money Wave has gone down into the Green Zone, and then turns up above 20.


