By ATGL
Updated March 13, 2026
Whether you’re a sole investor or a limited company, the ultimate goal should be to ensure that your investments — big or small — make financial sense. That’s why understanding investment metrics beforehand is vital for making informed investment decisions.
Metrics such as the profitability index help investors evaluate opportunities and allocate capital more effectively across competing investments. Investors interested in learning how valuation tools, portfolio construction, and risk management fit into broader decision-making frameworks can explore the Investment Strategy Guide, which outlines how different investment strategies are selected and implemented.
One such metric is the profitability index (PI), otherwise known as the profit investment ratio or value investment ratio. PI involves calculating the viability and profitability of potential investments before investing in them, so that you can make informed decisions based on your evaluation. This article will provide a detailed guide for calculating PI, how to use it, and the difference between profitability index vs. NPV and other valuation metrics.
What Is the Profitability Index (PI) and What Is It Used For?
The profitability index (PI) is the ratio of the present value of future cash flows to the investment required. It’s expressed as a numerical value that provides insight into an investment’s potential profitability.
The PI index has several use cases for businesses and individual investors, such as:
- Investment Decision-Making: The primary use of the project profitability index is to assist investors in making informed decisions about potential investments. By comparing the present value of future cash flows to the initial investment, investors can gauge the desirability of an investment opportunity.
- Risk Assessment: The PI, when combined with other financial metrics, helps in assessing the risk associated with an investment by providing a comprehensive view of potential returns compared to the initial investment.
- Project Ranking: When faced with multiple investment options, the profitability index serves as a valuable financial tool for finding the most profitable projects and allows investors to prioritize projects with higher potential returns.
- Capital Budgeting: Since most companies have limited resources for investments, the profitability index helps in allocating these resources efficiently by identifying projects that are likely to yield the highest returns relative to the initial cost of capital.
The Profitability Index Formula Explained
The profitability index formula is as follows:
PI = (PV) Preset Value of Future Cash Flows ÷ Investment Required
The profitability index rule states that:
- If the PI is greater than 1, it indicates a potentially profitable investment. The higher the PI, the more attractive the investment appears.
- If the PI is less than 1, the investment may not be as lucrative or profitable and may result in a loss.
- If the PI is exactly 1, it implies that the investment will break even — it will be neither profitable nor unprofitable.
Present Value of Future Cash Flows
This is a financial metric that accounts for how time affects the value of money. It refers to the total amount of anticipated returns from the investment, adjusted for their present value. The formula for calculating PV is as follows:
PV = Future Cash Flow / (1+r)^t
Where:
- r is the discount rate
- t is the time period
Investment Required
The investment required or the initial investment cost represents the upfront financial requirements you must fulfill to initiate the investment. This might include expenses, such as purchase costs, installation fees, and any other initial expenditures associated with the investment.
Example of PI Calculations To Rank Investment Projects
To best understand how to calculate and rank investment projects using the profitability index equation, consider the following examples.
Example 1:
Consider Project A, where the Investment Required is $100,000 and the future cash flows and present values for the investment are as follows:
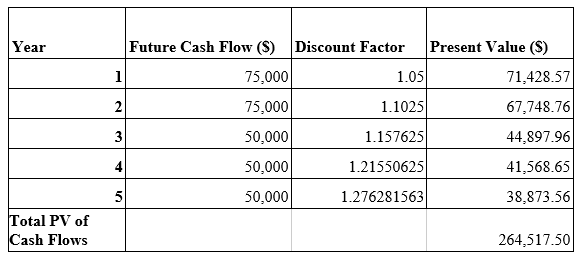
In the above table, we calculated the discount factor for each year using the formula (1+r)^t by employing a discount rate (r) of 5%. For instance, for year 1, the discount factor = (1+0.05)^1, Year 2 = (1+0.05)^2, and so forth.
As for the present value, we calculated each year’s amount by using the formula PV = Future Cash Flow / (1+r)^t. For instance, for year 1, PV = 75,000 / 1.05.
So, to calculate the PI:
PI = Total PV of Cash Flows / Investment Required
   = 264,517.50 / 100,000
   = 1.76345
Example 2:
In Project B, where the Investment Required is $120,000, and the discount rate (r) is 6%:
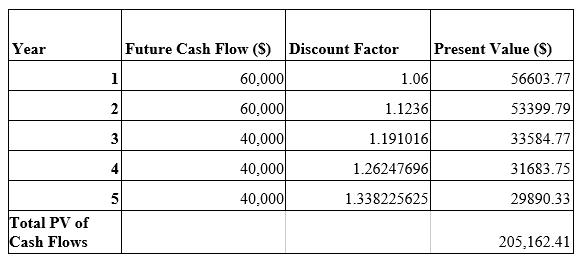
The PI for project B = 205,162.41 / 120,000
                     = 1.70968675
In the case of the two examples, since Project B has a slightly lower PI, then Project A is the most profitable project.
What Are Other Methods To Rank Investment Opportunities?
While the PI is an efficient method, there are other equally efficient valuation metrics for stocks that you can use to rank investment projects.
Net Present Value (NPV) is the first alternative method. This metric calculates the difference between the current or today’s value of cash inflows and cash outflows over a specific time.
The formula for NPV is: NPV= ∑ [Cash flow / (1+r)^t] − Initial Investment
A positive NPV indicates that the investment will generate value, while a negative NPV suggests the investment may not meet the required rate of return on investment.
The other method you can use is the Internal Rate of Return (IRR). IRR is the discount rate at which the Net Present Value (NPV) of all future cash flows an investment yields equals zero. To calculate IRR, solve the NPV equation for the discount rate where NPV equals zero. If the calculated IRR is greater than the discount rate used in the NPV calculation, the investment is then considered attractive.
Discover Potential Projects To Maximize Your Rate of Return
The profitability index is an important metric when making investment decisions. That’s why it’s a good idea to learn how to leverage PI investment for maximum profitability. Above the Green Line provides the best resources for investing in the stock market, so you don’t have to go in blind. We help our members invest in the market by leveraging market indicators for each unit of investment so they can make the best decisions. So, if you want to make the best investment decisions, sign up for a membership today.

Related Articles
[pt_view id=”9b64b383ox”]