By ATGL
Updated March 12, 2026
In options trading, a bear call spread is a strategic approach used when you expect a slight decline in the price of an underlying asset.
A bear spread involves a nuanced combination of selling and buying call options. It’s a popular technique among traders aiming to benefit from modest market downturns while managing risks effectively. Understanding the bear call spread is essential for diversifying your strategies in options trading.
Options strategies like the bear call spread represent just one approach within a broader investment framework. Investors interested in learning how options, swing trading, and long-term investing strategies fit together in disciplined portfolio construction can explore the Investment Strategy Guide, which outlines the principles behind selecting strategies based on market conditions and risk tolerance.
Bear Call Spread Explained
The bear call spread, or short call spread, is a bearish options strategy. You sell a call option, typically in-the-money (ITM) or at-the-money (ATM), and simultaneously buy a call option with a higher strike price but the same expiration date. This setup forms a credit spread, as you receive a premium from the sale of the lower strike call, offset partially by the cost of the higher strike call.
Many traders prefer this strategy over shorting stock due to its lower margin requirements. Options are generally less expensive than stocks, and the bear spread offers a hedge through the purchase of the higher strike call option, which offsets potential losses from the short call.
However, since options have expiration dates, the effectiveness of this strategy hinges on the underlying stock decreasing in value before the contracts expire.
A bear call spread has two appealing features: limited risk and limited return. While this caps the potential gains, it also controls the maximum loss, making it a balanced strategy for those cautious of significant market downturns. Even with this limited return potential, you can make substantial profits when the stock moves downward as anticipated.

What Are the Basic Bear Call Credit Spread Calculations?
In a bear call spread, knowing the maximum loss, maximum gain, and break-even points is crucial.
The maximum profit potential is typically the credit received times 100. This is the net amount received from establishing the spread.
The maximum loss potential is the difference between the call strikes minus the credit received, multiplied by 100. This represents the worst-case scenario if the stock price rises above the higher strike price at expiration.
Find the break-even point by adding the credit received to the strike price of the short call. This is the stock price at which you neither make nor lose money, excluding commissions and fees.
These calculations are important to understanding your potential return and risk before entering a trade. By knowing these figures, you can align your strategies with your risk tolerance and market expectations.
When Should You Consider a Bear Call Spread?
A bear call spread is best employed when you expect a slight decrease in a stock’s price. This strategy is not meant for scenarios where a significant plunge is expected.
In times of high market volatility, bear call spreads can be more profitable because high implied volatility often translates into increased premium income. However, it’s important to remember that volatility affects both legs of the spread.
This strategy is a method of risk mitigation. Unlike uncovered short call options, a bear call spread limits the maximum loss to a predefined amount. This makes it a safer option for traders who are bearish on a stock but cautious about potential market swings.
How Can You Tailor a Bear Spread to Your Risk Profile?
Adjusting the strike prices of the call options is one way to manage risk. Selecting strikes that align with your market outlook and risk tolerance can significantly impact the potential returns and losses.
If you’re more conservative, you may choose to use strikes that are further out of the money, reducing your potential return but also limiting your risk. For those with a higher risk tolerance, using closer-to-the-money strikes can provide a potentially higher return, but it also carries more risk.
Choosing the right expiration date is also crucial. Options with longer expiration dates might have higher premiums due to the increased time value, but they also carry greater risk as the market has more time to move unfavorably.
Monitoring the trade actively is mandatory, especially in volatile markets. You should be prepared to make adjustments or exit the trade if the market moves against your position.
What Are Some Examples of This Type of Vertical Spread?
Suppose you believe a stock currently trading at $100 will experience a slight decline. You could execute a bear call spread by selling a call option with a strike price of $100 and buying a call option with a strike price of $105, both with the same expiration date.
If the stock price remains below $100, you keep the premium received. However, if the stock price exceeds $105, your losses are capped at the difference between the two strike prices, minus the premium received.
Unlock the Most Profitable Stock Trades With Our Proven System
The bear call spread is an effective strategy for options traders aiming to capitalize on modest downturns in the stock market. It offers a balanced mix of risk and reward, with its limited risk feature appealing to those cautious about substantial market shifts.
However, mastering options trading strategies like the bear call spread requires knowledge, experience, and the right resources. This is where our proven system at Above the Green Line comes into play.
We provide traders with comprehensive insights, tools, and guidance to navigate the complexities of the stock market effectively. By joining our community, you gain access to expert analysis, real-time trading advice, and a supportive network of fellow traders. Instead of just buying the Dow 30, S&P 500, or Nasdaq 100 indexes and calling it a day, we empower you to unlock the full potential of your investment portfolio.
Sign up today and become part of a community that thrives on making smart, informed trading decisions.

Related Articles

Risk-Adjusted Returns: Why Smarter Investors Focus on More Than Performance

Moving Average Crossover Strategy: Using Trend Confirmation to Reduce Emotional Trading

Retirement Investment Strategies: The Phase-by-Phase Framework That Changes How You Approach Every Stage
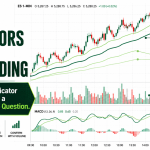
Best Indicators for Day Trading: The 7 That Elite Traders Actually Use (And Why Most Lists Get It Wrong)
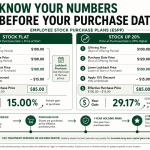
ESPP Explained: The Employee Stock Purchase Plan Most Workers Leave Money On the Table By Ignoring