
HAPPY EASTER!
4/17/2022 Markets were lower again for the week as longer term Interest Rates continued higher. Now Long Term Treasury Bonds are down 28% from the 2020 High as the Herd worries about the FED raising short term Interest Rates. T-Bonds are 14 % Below the Green Line on emotional FEAR Selling by Tammy, but higher long term Interest Rates will normally cause a slow down, and rates will eventually fall.
Currently the tangible Commodities are Way Above the Green Lines, and Bonds are Way Below the Green Lines. Both will eventually return to the Green Lines, so maybe we will see a Stock Market rally when Interest Rates and Inflation fall.
If you continue to Follow the Green Line System, your Money should flow into the Strongest areas and your account value should be able to grow in both Bull and Bear Markets.
Still slower action this week on the Day Trading Scrolling Charts.
DAY TRADING CHARTS FOR INDICES & LARGE CAPS.
We have not had many intra-day Trade Alerts lately as the Volume has been too Low with the Buy Signals. These Buy Signals tend to pop up and quickly fade back down. We like to see High Volume on rallies.
For the week the Dow was down 0.85%, the S&P 500 was down 2.19%, and the NASDAQ 100 was down 3.07%. The Long Term Trend for the Indices is up.
The Inflation Index (CRB) was up 4.60% for the week and is Above the Green Line, indicating Economic Expansion.
Bonds were down 3.49% for the week, and are Way Below the Green Line, indicating Economic Expansion.
The US DOLLAR was up 0.57% for the week and is Above the Green Line.
Crude Oil was up 8.84% for the week at $106.95 and GOLD was up 1.51% at $1974.90.
_____________________________________________________________________________________________
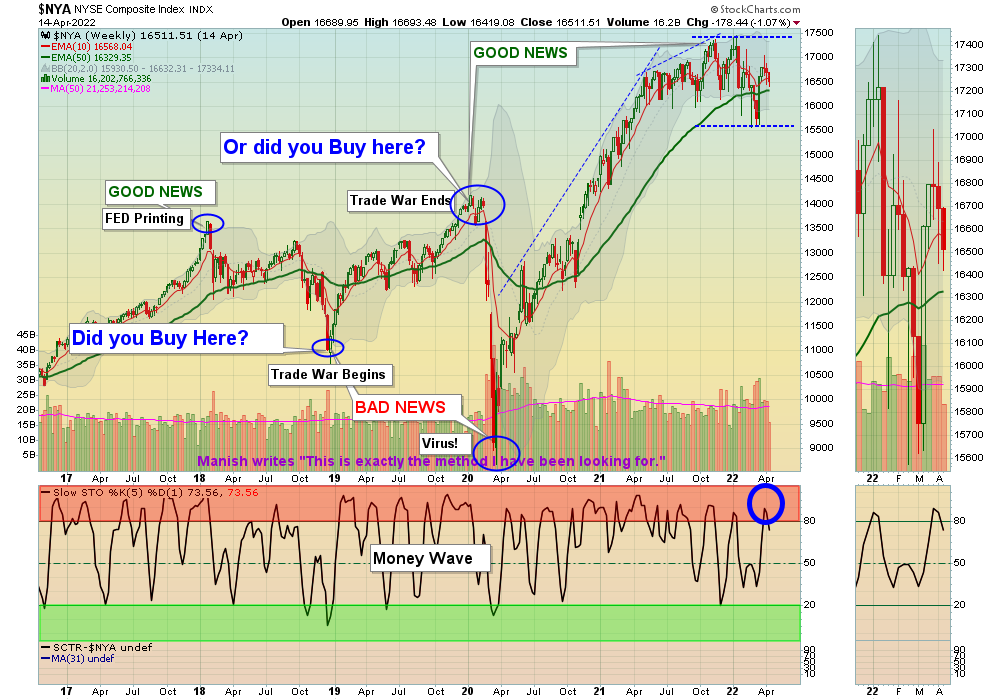
MONEY WAVE BUYS SOON
We are in only 3 logged Current Positions for the Short & Medium Term, and we have CASH to Buy 7 more soon. There are 6 investments on the Short Term Watch List.
Be patient and WAIT for Green Zone Buy Signals!
_________________________________________________________________________________________
LONG TERM INVESTMENTS (Hard to find Large Caps because most no longer have 80 Relative Strength required.)
Long Term Scrolling Charts (Real Time)
BLDR BUILDERS FIRSTSOURCE Buy above $63.99 with High Volume with a 5% Trailing Sell Stop Loss below it.
F FORD MOTOR CO. Buy if it Closes above $17.80 with High Volume.
RRPIX RISING INTEREST RATES FUND Closed above $30.20, but the weekly & daily Money Wave are up in the Red Zone. Wait for the next Daily Money Wave Buy Signal.
________________________________________________________________________________
My Trading Dashboard
Swing Trading Scrolling Charts
Day Trading Scrolling Charts
Click for Watch Lists
Click for Current Positions
Click for Closed Positions
Updated Top 100 List Apr 2, 2022
Dividend Growth Portfolio
Updated ETF Sector Rotation System
Dogs of the DOW System
Long Term Strategy for IRAs & 401k Plans
CNN Fear & Greed Index
Scrolling Stage Chart Investing Charts
Alert! Market Risk is MEDIUM (Yellow). The probability of successful Short Term Trades is better, when the % of stocks above the 50-day avg. is below 20.
Tell your Friends about the Green Line, and Help Animals.
________________________________________________________________________________
QUESTION: Jim S. writes “Why do you use the 250 vs 200 or any other moving average? And, in a bear market, are you concerned that your Money Wave (slow sto line) might get stuck in the Green Zone for an extended period or give false breakout buy signals?
ANSWER: Hi Jim. The 250-day average (Green Line) has been back tested and has fewer “false Sell Signals” than the 200-day. The question should be: Why do most investors use the inferior 200-day average?
In the next Bear Market, we should be in Inverse Funds (like SH) which we were in the 2008 Bear (with good success)… In a Bear Market, most investments will be Below the Green Lines. The Green Line Rules do not allow us to own weaker investments Below the G L.
But historically there will always be investments Above the Green Lines, and we should have them for you.
Good trading and tell your friends!
ATGL


