
8/22/2021 Markets were slightly lower for the week, as many Stocks have really dropped on Virus slowdown Fears. But the S&P 500 & DOW 30 Indices have held up very as the Money has rolled into the very largest capitalized Stocks. Crude Oil dumped 9% this week.
The Markets still don’t seem to care much about anything negative like Inflation or the Virus until the FED slows down on Printing. Most do not expect to the FED to begin tapering until their September meeting, at the earliest.
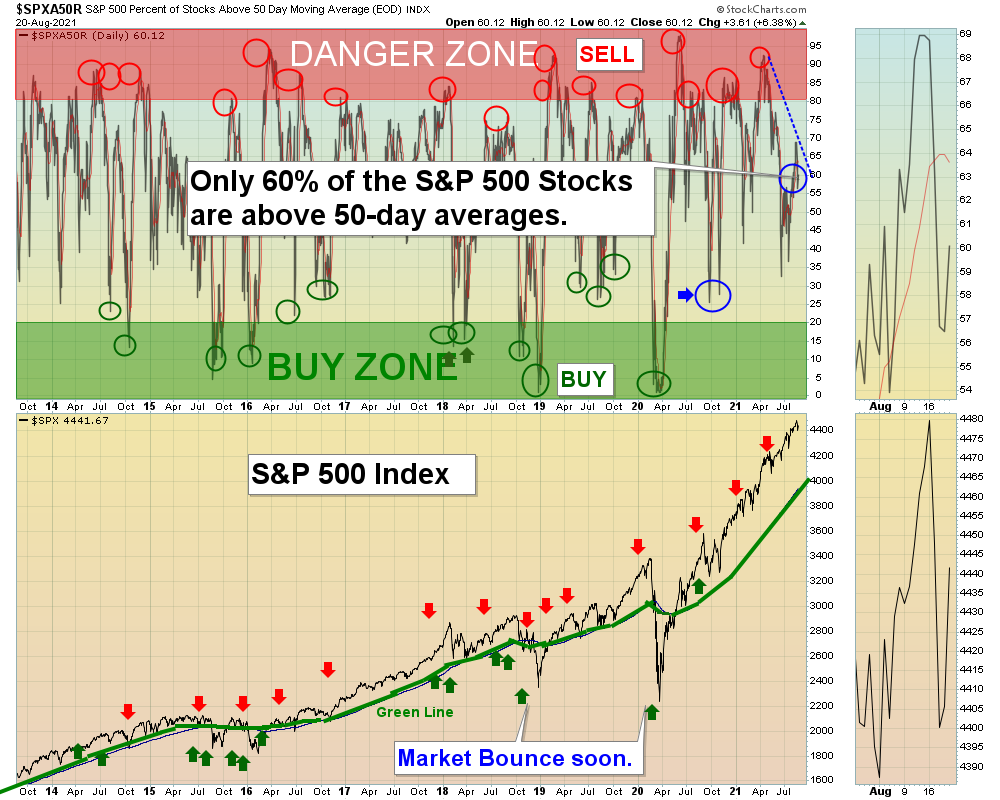
There are quite a few strong Stocks below that have corrected down to the Green Lines (Long Term Scrolling Charts). If these don’t bounce up soon, it would indicate a very tired Market. Market internals have been weakening (breadth, Volume, New Highs, etc.) which are normally warning signs of a Market pull-back. So the question is which month will the Markets return to their Green Lines?
If you continue to Follow the Green Line System, your Money should flow into the Strongest areas and your account value should be able to grow in both Bull and Bear Markets. No predicting here, just Following the Money.
We are having good success lately by using Triple Buy Signals on the Day Trading Scrolling Charts.
For the week the Dow was down 1.02%, the S&P 500 was down 0.57%, and the Nasdaq 100 was down 0.30%. The Long Term Trend for the Indices is up.
The Inflation Index (CRB) was down 4.61% for the week and is Above the Green Line, indicating Economic Expansion.
Bonds were up 1.35% for the week, and are Above the Green Line, indicating Economic Contraction.
The US DOLLAR was up 1.08% for the week and is back Above the Green Line.
Crude Oil was down 9.21% for the week at $62.14 and GOLD was up 0.33% at $1784.00.
_____________________________________________________________________________________________
MONEY WAVE BUYS SOON
We are currently in 4 logged Current Positions, for the Short & Medium Term. There are 8 investments on the Short Term Watch List.
Be patient and WAIT for Green Zone Buy Signals!
______________________________________________________________________________________________
LONG TERM INVESTMENTS (Some Leaders have pulled back , but Markets are near Highs.)
Long Term Scrolling Charts (Real Time)
AMC AMC ENTERTAINMENT Buy if it Closes above the Red Line (50-day avg.) with High Volume.
CZR CAESARS ENTERTAINMENT Buy if it Closes above the Red Line (50-day avg.) with High Volume.
F FORD MOTOR CO. Buy if it Closes above the Red Line (50-day avg.) with High Volume.
GME GAME STOP CORP. Buy if it Closes above the Red Line (50-day avg.) with High Volume.
KIRK KIRKLAND’S INC. Buy if it Closes above the Red Line (50-day avg.) with High Volume.
KOPN KOPIN CORP. Buy if it Closes above the Red Line (50-day avg.) with High Volume.
URA URANIUM FUND Buy if it Closes above the Red Line (50-day avg.) with High Volume.
XOP OIL & GAS EXPLORATION FUND Buy if it Closes above the Red Line (50-day avg.) with High Volume.
ZKIN ZK INT’L. GROUP Buy if it Closes above the Red Line (50-day avg.) with High Volume.
______________________________________________________________________________________
My Trading Dashboard
Swing Trading Scrolling Charts
Day Trading Scrolling Charts
Click for Watch Lists
Click for Current Positions
Click for Closed Positions
Updated Top 100 List Aug 1, 2021
Dividend Growth Portfolio
ETF Sector Rotation System
Dogs of the DOW System
Long Term Strategy for IRAs & 401k Plans
CNN Fear & Greed Index
Scrolling Stage Chart Investing Charts
Alert! Market Risk is MEDIUM (Yellow Zone). The probability of successful Short Term Trades is better, when the % of stocks above the 50-day avg. is below 20.
Tell your Friends about the Green Line, and Help Animals.
___________________________________________________________________________________________
QUESTION: Jeff writes “Hello, in trying to understand your “DONT TAKE A LOSS” comments. Why don’t you raise the stop loss when the stock pops up so much? I am not capturing a lot of upside, as I wait and get out conservatively. Is the point to let them run with a large stop loss to capture maximum upside?
ANSWER: Hi Jeff. When a Stock is really running, having a Stop below the Pink Line usually works well. But sometimes they “Gap Up” way above all averages. There is no correct answer, except that we know that the Investment will eventually return to all of the averages. Try to judge if the Market is very Strong or not…
In the current Market, we are capturing smaller Gains… Holding on for more could be determined by calculating the Reward / Risk ratio of 2:1. (Can it go up $4 more with downside of only $2?) Also some members want to see more longer term results by strictly following the Rules.
When the Money Wave > 50, then the Stop is raised to the Buy Price. (Don’t Take a Loss!). Probability says to “Get Out Even” and wait for the next trade.
Thanks for writing.
ATGL


