Above the Green Line -01
  • Market Insights
        • Commentary
          • Daily
          • Weekly
        • BUY / SELL SIGNALS
          • Trade Posts
          • Recent Trade Alerts
          • Recent Day Trades
        • BLOGROLL
          • Dividend Growth Blog
          • ETF Sector Blog
          • Dow Dogs
          • TPOW Blog
  • Strategies
        • SWING TRADING
          • Current Positions
          • Watchlists
          • Closed Positions
          • Candidates - TOP 100
          • Specialty Stocks
        • WEEKLY STOCK PICK
          • TPOW Charts
          • TPOW Performance
          • TPOW Strategy Guide
          • TPOW Performance Dashboard
        • DAY TRADING
          • Watch List
        • ATGL DASHBOARD
        • ETF STRATEGIES
          • ETF Sector Rotation
          • ETF Sector Portfolio
        • DIVIDEND GROWTH
          • Dividend Growth Portfolio
          • Dividend Calendar
        • DOGS OF THE DOW
          • Dogs of the Dow Portfolio
          • DOW 5 Portfolio
  • Markets
        • US MARKET
          • Commodities
          • Energy
          • Precious Metals
          • Volatility
        • GLOBAL MARKETS
          • Market Indices
          • Economic Calendar
          • FOREX Heat Map
          • FOREX Cross Rates
          • Crypto Currency Market
  • Investing
    • Discord Community
    • Dashboard
  • Resources
        • ARTICLES
          • Dividend Growth Model Articles
          • ETF Articles
          • Investment Strategies Articles
          • Market and Economic Insights
          • Stock Trade Articles
          • Stock Reviews
        • TOOLS
          • Stock Scanners
          • Charting Software
          • Brokerage Firms
        • STOCK CHARTS
          • Key Components
          • Reading Charts
          • Drawing Stock Charts
          • Identifying Trends
        • RETIREMENT PLANNING
  • About
    • Contact Us
    • How to Win
    • #1 At Stockcharts
    • Disclaimer
    • FAQ
  • Log In
  • Subscribe

January 31, 2021

Green Line Weekly Jan 31, 2021

M2 Chart
The FED is still Printing Money to prop up the Markets.

1/31/2021 Markets were lower for the week on profit taking. The major Indices were on Highs last week and were very over-bought and were Way Above the Green Lines.  

FEAR has quickly returned to the Markets as the  CNN Fear & Greed Index  is back down to 38, after being up at 92 late last year. We like to BUY on FEAR, and the Leaders are coming down to the Green Zones for some Short Term trades soon, The weakest major Index is the DOW 30, and it closed below the Red Line (50-day average) which is bearish. But the Strongest Index is currently the Small Cap Fund (IWM) and it is well above the Red Line and should have a Money Wave Buy Signal soon. 

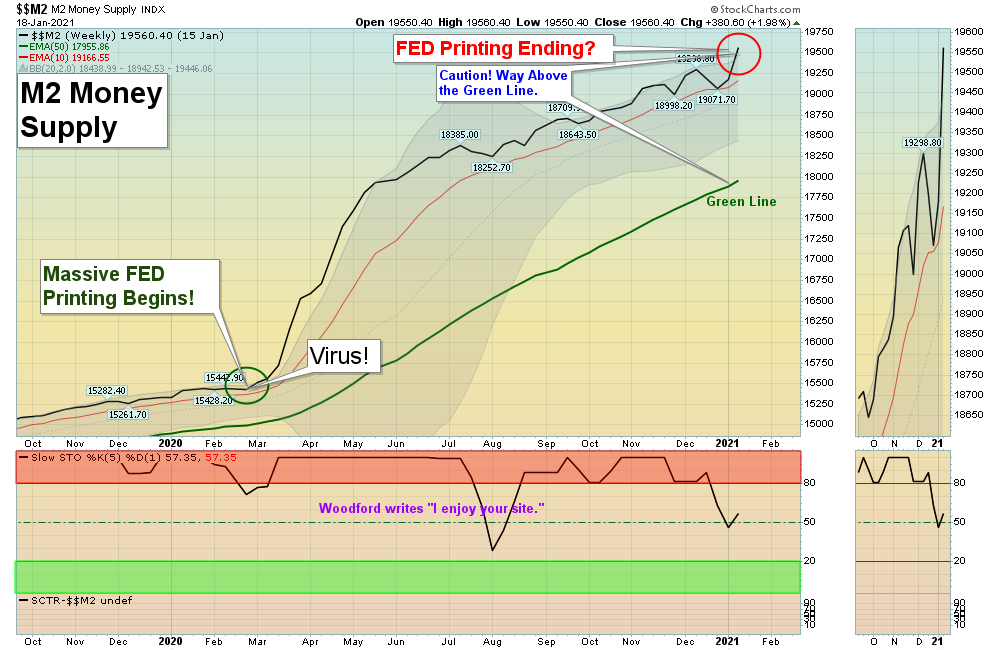
The FED is continuing to Print aggressively, so the Markets should be ok until the Indices can no longer make New Highs (Sell Signal). Bonds are also being propped up by the FED at $120 Billion of monthly Buying, so we will watch for any changes there. Higher Commodity Prices are worrying the Bond Markets, and could eventually force the FED to stop Printing when Inflation returns.

SEE SUPPLEMENTAL CHARTS

Completed Trades this week:

MARA      MARATHON PATENT      Jan 29 Target Hit at $24 for a 31.1 % Gain.  This trade was not logged.
MVIS      MICROVISION INC.      Jan 25 Target was Hit at $7.50 for a 26.9 % Gain. This trade was not logged.  
OSTK       OVERSTOCK.COM      Jan 26 Target Hit at $85 for a 40 % Gain. This trade was not logged.

For the week the Dow was down 3.27%, the S&P 500 was down 3.35%, and the Nasdaq 100 was down 3.34%. The Long Term Trend for the Indices is up. 

The Inflation Index (CRB) was up 0.78% for the week and is Above the Green Line, indicating Economic Expansion.

Bonds were up 0.08% for the week, and are Below the Green Line, indicating Economic Expansion.

The US DOLLAR was up 0.33% for the week. 

Crude Oil was down 0.13% for the week at $52.20 and GOLD was down 0.32%  at $1850.30.

_____________________________________________________________________________________________

MONEY WAVE BUYS SOON

We are currently in 3 logged Current Positions, for the Short & Medium Term.  There are 7 Investments on the Short Term Watch List. 

Be patient and WAIT for Green Zone Buy Signals!

______________________________________________________________________________________________

LONG TERM INVESTMENTS  (Most of the Leaders are back up in the Weekly Red Zones.)

Buy the Leading Investments that are down near the Weekly Green Zones.      

CBAY      CYMABAY THERA.      Buy if it Closes $6.73 on High Volume.    

FDX      FEDEX CORP.      Buy if it Closes above the Daily Red Line on High Volume.     

MJ      MARIJUANA FUND      Wait for the next Daily Money Wave Buy Signal.   

PLG      PLATINUM METALS GROUP      Wait for the next Daily Money Wave Buy Signal.   

ZM       ZOOM VIDEO      Buy when it Closes above $404.44 on High Volume.

______________________________________________________________________________________

Click for  Watch Lists
Click for  Current Positions
Click for  Closed Positions

New: My Trading Dashboard

Day Trading Watch List

NEW TOP 100 LIST Jan 31, 2021

Dividend Growth Portfolio  

ETF Sector Rotation System      

Dogs of the DOW System

Long Term Strategy for IRAs & 401k Plans

CNN Fear & Greed Index

Alert! Market Risk is MEDIUM (Yellow Zone). The probability of successful Short Term Trades is better, when the % of stocks above the 50-day avg. is below 20. 

Tell your Friends about the Green Line, and Help Animals.

___________________________________________________________________________________________

4 Ways to Get your Daily Money Wave Alert:

  • Emailed to your box between 3:40 3:50pm ESDT.
  • Website menu Commentary/Buy/Sell Signals
  • Twitter notifications are the fastest and most reliable:  @AboveGreenLine
  • Text messages: Email us your Cell number & phone carrier.


Thank you,


AGL


Related Post

– Green Line Weekly Jan 24, 2021

Subscribe to Our Newsletter

AGL Logo

Get our eBook Now!

Candlestick - A Swing Traders Friend

We don’t spam! Read our privacy policy for more info.

You’ve been successfully subscribed to our newsletter!

Voted #1 at Stock Charts

SH Chart
Inverse S&P 500 Fund (SH) will have a Money Wave Buy today.

Help Us Help Animals

Help Us Help Animals

Recent Comments

  • Market Breadth Indicators: A Trader’s Guide to Early Trend Detection on Backtesting: Definition and How a Trading Strategy Backtest Works
  • Island Reversal Pattern: Definition and Formation Explained on Double Top Pattern: How to Identify and Trade This Reversal Signal
  • Channel Pattern Guide: What It Is and Why It Matters on A Guide to Forecasting Using Moving Averages
  • What Is a Broadening Bottom Chart Pattern? Full Guide on Bull vs. Bear Market: An Investor’s Guide to Market Phases
  • ATGL Weekly Money Flow - 2025-05-11 on ATGL Top Pick of the Week! Apr 6, 2025

Become a Green Liner!

Help me make more Money in the Stock Market.

ON ATGL

  • DashBoard
  • Weekly Commentary
  • Daily Buy / Sell Signals
  • Day Trade Setup
  • Trading Rooms

Design & Develop By Pixelvect

STRATEGIES

  • Swing Trading
  • ATGL Pick of the Week
  • Dividend Growth
  • ETF Sector Rotation
  • Dogs of the Dow

HELP

  • ATGL Trading Rules
  • FAQ
  • Account Maintenance
  • Contact US
  • Join

FOLLOW US

Instagram Linkedin Twitter Facebook

© COPYRIGHT 2024 · ABOVETHEGREENLINE.COM · ALL RIGHTS RESERVED · PRIVACY · TERMS · CONTACT · WATCHLIST · CURRENT