
1/24/2021 Markets were higher for the week on hopes of more Gov’t. Spending this year. Many of the major Indices are near Highs but are very over-bought and are Way Above the Green Lines.
Many Investors use Fundamental Analysis to determine the fair market value of investments. This method measures a security’s intrinsic value by examining economic and financial values and then attempts to estimate or predict future events. At Above the Green Line, we use Technical Analysis, where we study how Fundamental Investors have spent their Money.
Investors do not have an unlimited amount of Money to put into the Markets, and historically when most of the technical indicators reach the high levels of today, it means that Investors are almost fully invested. Then Smart Money raises Cash and eventually Bad News comes out. We don’t know what the Bad News will be, but when it happens, the Herd will be shocked and many Investments will return back down to their Green Lines again. A good example was last January the Markets were very extended and then the Virus began.
Markets returning back down to the Green Lines is not popular by most, but it usually happens once or twice a year. The Green Line represents the Investment’s intrinsic value after removing our human emotions: Fear & Greed. In Jan 2020, Markets were Way Above the Green Lines (over-bought), and then in March the Markets went Way Below the Green Lines (over-sold). So we bought the Leaders in March that held up well on the next Buy Signal. And last year was the best year ever for the Green Line Swing Trading account, so we do not FEAR Corrections.
Currently the Markets are too far Above the Green Lines to justify a 2:1 Reward / Risk Ratio. So prudent Investors who like to Buy on FEAR and should be raising Cash up here.
For the week the Dow was up 0.60%, the S&P 500 was up 1.91%, and the Nasdaq 100 was up 4.35%. The Long Term Trend for the Indices is up.
The Inflation Index (CRB) was down 1.37% for the week and is Above the Green Line, indicating Economic Expansion.
Bonds were up 0.04% for the week, and are Below the Green Line, indicating Economic Expansion.
The US DOLLAR was down 0.57% for the week.
Crude Oil was down 0.29% for the week at $52.27 and GOLD was up 1.44% at $1856.20.
_____________________________________________________________________________________________
MONEY WAVE BUYS SOON
We are currently in 2 logged Current Positions, for the Short & Medium Term. There are 5 Investments on the Short Term Watch List.
Be patient and WAIT for Green Zone Buy Signals!
______________________________________________________________________________________________
LONG TERM INVESTMENTS (Most of the Leaders are back up in the Weekly Red Zones.)
Buy the Leading Investments that are down near the Weekly Green Zones.
CBAY CYMABAY THERA. Buy if it Closes $6.73 on High Volume.
CRON CRONOS GROUP Wait for the next Daily Money Wave Buy Signal.
CYH COMMUNITY HEALTH Target of $10 was Hit this week for 19.3 % Gain. This trade was not logged.
FDX FEDEX CORP. Buy if it Closes above the Daily Red Line on High Volume.
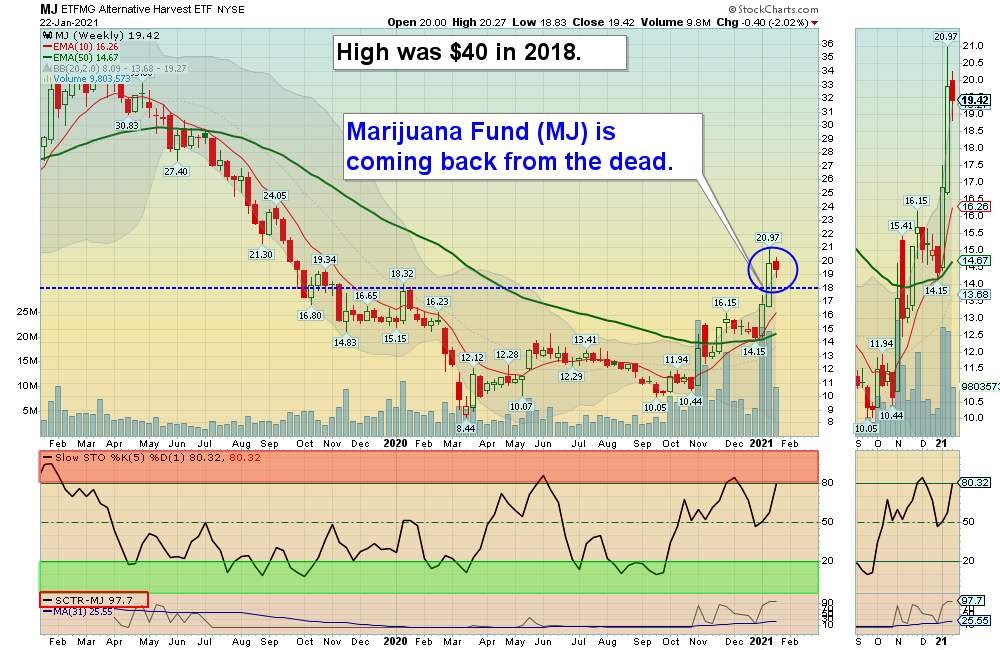
MJ MARIJUANA FUND Wait for the next Daily Money Wave Buy Signal.
ZM ZOOM VIDEO Wait for Close Above the Daily Red Line.
______________________________________________________________________________________
Click for Watch Lists
Click for Current Positions
Click for Closed Positions
New: My Trading Dashboard
Long Term Strategy for IRAs & 401k Plans
Alert! Market Risk is HIGH (Red Zone). The probability of successful Short Term Trades is better, when the % of stocks above the 50-day avg. is below 20.
Tell your Friends about the Green Line, and Help Animals.
___________________________________________________________________________________________
Merry Me writes “Thank you for the new Dashboard. It is nifty.
I love being able to scroll through the charts quickly in the morning.”


