Above the Green Line -01
  • Market Insights
        • Commentary
          • Daily
          • Weekly
        • BUY / SELL SIGNALS
          • Trade Posts
          • Recent Trade Alerts
          • Recent Day Trades
        • BLOGROLL
          • Dividend Growth Blog
          • ETF Sector Blog
          • Dow Dogs
          • TPOW Blog
  • Strategies
        • SWING TRADING
          • Current Positions
          • Watchlists
          • Closed Positions
          • Candidates - TOP 100
          • Specialty Stocks
        • WEEKLY STOCK PICK
          • TPOW Charts
          • TPOW Performance
          • TPOW Strategy Guide
          • TPOW Performance Dashboard
        • DAY TRADING
          • Watch List
        • ATGL DASHBOARD
        • ETF STRATEGIES
          • ETF Sector Rotation
          • ETF Sector Portfolio
        • DIVIDEND GROWTH
          • Dividend Growth Portfolio
          • Dividend Calendar
        • DOGS OF THE DOW
          • Dogs of the Dow Portfolio
          • DOW 5 Portfolio
  • Markets
        • US MARKET
          • Commodities
          • Energy
          • Precious Metals
          • Volatility
        • GLOBAL MARKETS
          • Market Indices
          • Economic Calendar
          • FOREX Heat Map
          • FOREX Cross Rates
          • Crypto Currency Market
  • Investing
    • Discord Community
    • Dashboard
  • Resources
        • ARTICLES
          • Dividend Growth Model Articles
          • ETF Articles
          • Investment Strategies Articles
          • Market and Economic Insights
          • Stock Trade Articles
          • Stock Reviews
        • TOOLS
          • Stock Scanners
          • Charting Software
          • Brokerage Firms
        • STOCK CHARTS
          • Key Components
          • Reading Charts
          • Drawing Stock Charts
          • Identifying Trends
        • RETIREMENT PLANNING
  • About
    • Contact Us
    • How to Win
    • #1 At Stockcharts
    • Disclaimer
    • FAQ
  • Log In
  • Subscribe

March 1, 2020

Green Line Weekly Mar 1, 2020

Oversold Chart
The Markets should bounce soon from being Over-sold like at the 2018 Low.


03/01/2020:  Markets were down big for the week as the Markets had been Way Above the Green Lines (GREED), and the weaker Indices (Small Caps, NYSE & Transports) could not make Higher Highs (Warning). Many will blame the drop on the Corona Virus, but as Technical Analysts, we don’t really care WHY human Emotions flip from Greed to Fear.  We just know that human Emotions are temporary. And Emotions allow wise Investors who Buy on FEAR and Sell on GREED to make money. The CNN Fear & Greed Index is down from 95 (Greed) in Jan. to 9 (Fear). Classic!

Only the NASDAQ 100 Index is currently Above the Green Line, so it is normally safer to only put new Money in the NASDAQ 100 Fund (QQQ) at this time.

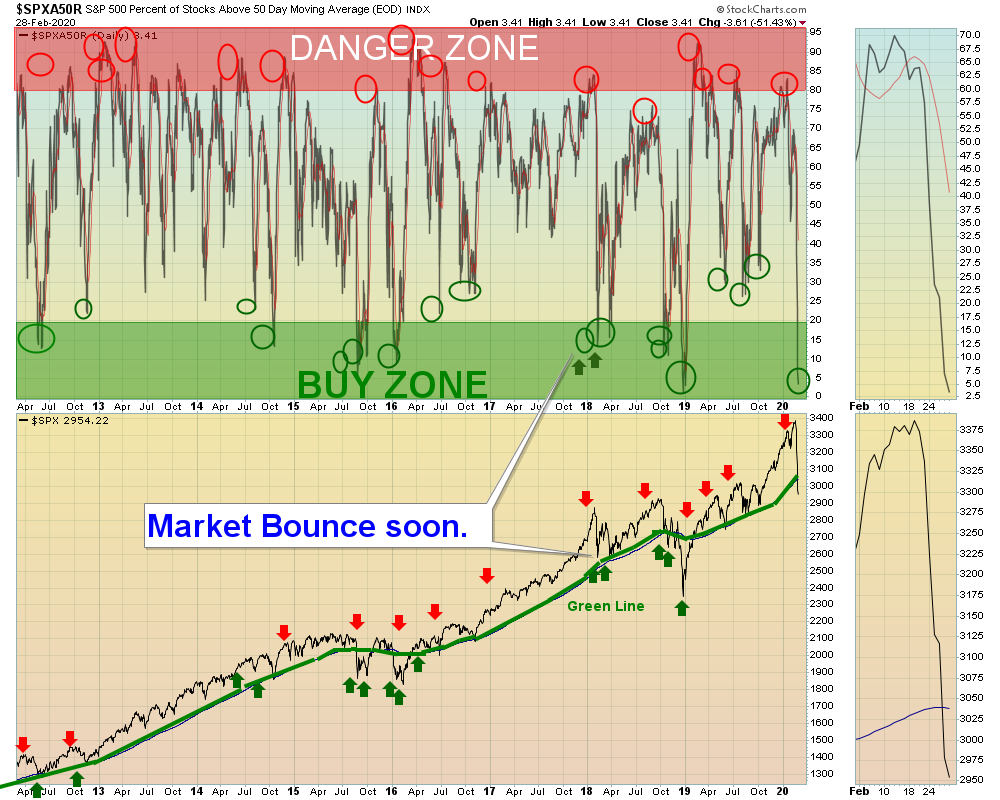
The Markets should have an over-sold bounce soon. But since the decline last week was very steep, it will normally take the Markets a while to heal (normally a pop up, then back down again). That is why you should Buy only the Strongest Leaders which are finally back in the Green Zones for Money Wave Buys soon.

New Subscribers:  The Leaders are now back down in the Green Zones.  Please be patient and WAIT for Green Zone Buys soon. 

For the week the Dow was down 12.36%, the S&P 500 was down 11.16%, and the Nasdaq 100 was down 10.43%.  The Long Term Trend on the Stock Markets is UP. 


The Inflation Index (CRB) was down 8.70% and is Below the Green Line, indicating Economic Weakness.

Bonds  were up 4.91% for the week and are Above the Green Line, indicating Economic Weakness.

The US DOLLAR was down 1.12% for the week after making New Highs last week. 

Crude Oil was down 16.15% for the week at $44.76 and GOLD was down 4.98%  at $1566.70.

_____________________________________________________________________________________________

MONEY WAVE BUYS SOON:   

We are currently in 3 logged Open Positions, for the Short & Medium Term.  There are 16 Investments on the Short Term Watch List. 

Be patient and WAIT for Green Zone Buy Signals!

______________________________________________________________________________________________

LONG TERM INVESTMENTS  (concentrating more on the Short Term now)

Buy the Leading Investments that are down near the weekly Green Zones.     

ARWR     ARROWHEAD PHARMA.     Buy if it Closes above $46.42 on High Volume.      

CYH     COMMUNITY HEALTH SYSTEMS       Buy on the next Daily Money Wave Buy Signal soon.   

DB     DEUTSCHE BANK     Buy on the next Daily Money Wave Buy Signal soon.   

GDX     GOLD MINERS FUND      Buy if it Closes above $31.06 on High Volume. 

GE     GENERAL ELECTRIC CORP.     Buy on the next Daily Money Wave Buy Signal soon.     


______________________________________________________________________________________

Click for  Portfolio (Open Positions)
Click for  Watch List
Click for  Closed Positions


New ETF Sector Rotation System

Dogs of the DOW System

Long Term Strategy for IRAs & 401k Plans:   Currently invested in all 4 Funds. 

Alert! Market Risk is LOW (Green Zone). The probability of successful Short Term Trades is better, when the % of stocks above the 50-day avg. is below 20. 

Tell your Friends about the Green Line, and Help Animals

___________________________________________________________________________________________

QUESTION: Dan S. writes:  On your short term on deck selections, are we to buy using the 60 min chart  or the the daily chart? The comments say “wait for the money wave to close > 20”.  I notice the Daily chart money wave will show below 20 while the 60 min wave will show >20. 

Does the system trigger the actual buy signal based on the daily chart or the 60 min chart for short term investments?

ANSWER: Hi Dan. All Signals are based on the Daily Money Wave (Slow Stochastic) Closing > 20.  Please follow the Signals on the Daily Email Alerts.

If the Daily money Wave is going to Close > 20 on the day, you can use JUMP START (60-min charts) to try for a better price during the day.

Thank you,

AGL


Related Post

– Green Line Weekly Feb 22, 2020

Subscribe to Our Newsletter

AGL Logo

Get our eBook Now!

Candlestick - A Swing Traders Friend

We don’t spam! Read our privacy policy for more info.

You’ve been successfully subscribed to our newsletter!

Voted #1 at Stock Charts

SH Chart
Inverse S&P 500 Fund (SH) will have a Money Wave Buy today.

Help Us Help Animals

Help Us Help Animals

Recent Comments

  • Market Breadth Indicators: A Trader’s Guide to Early Trend Detection on Backtesting: Definition and How a Trading Strategy Backtest Works
  • Island Reversal Pattern: Definition and Formation Explained on Double Top Pattern: How to Identify and Trade This Reversal Signal
  • Channel Pattern Guide: What It Is and Why It Matters on A Guide to Forecasting Using Moving Averages
  • What Is a Broadening Bottom Chart Pattern? Full Guide on Bull vs. Bear Market: An Investor’s Guide to Market Phases
  • ATGL Weekly Money Flow - 2025-05-11 on ATGL Top Pick of the Week! Apr 6, 2025

Become a Green Liner!

Help me make more Money in the Stock Market.

ON ATGL

  • DashBoard
  • Weekly Commentary
  • Daily Buy / Sell Signals
  • Day Trade Setup
  • Trading Rooms

Design & Develop By Pixelvect

STRATEGIES

  • Swing Trading
  • ATGL Pick of the Week
  • Dividend Growth
  • ETF Sector Rotation
  • Dogs of the Dow

HELP

  • ATGL Trading Rules
  • FAQ
  • Account Maintenance
  • Contact US
  • Join

FOLLOW US

Instagram Linkedin Twitter Facebook

© COPYRIGHT 2024 · ABOVETHEGREENLINE.COM · ALL RIGHTS RESERVED · PRIVACY · TERMS · CONTACT · WATCHLIST · CURRENT