Above the Green Line -01
  • Market Insights
        • Commentary
          • Daily
          • Weekly
        • BUY / SELL SIGNALS
          • Trade Posts
          • Recent Trade Alerts
          • Recent Day Trades
        • BLOGROLL
          • Dividend Growth Blog
          • ETF Sector Blog
          • Dow Dogs
          • TPOW Blog
  • Strategies
        • SWING TRADING
          • Current Positions
          • Watchlists
          • Closed Positions
          • Candidates - TOP 100
          • Specialty Stocks
        • WEEKLY STOCK PICK
          • TPOW Charts
          • TPOW Performance
          • TPOW Strategy Guide
          • TPOW Performance Dashboard
        • DAY TRADING
          • Watch List
        • ATGL DASHBOARD
        • ETF STRATEGIES
          • ETF Sector Rotation
          • ETF Sector Portfolio
        • DIVIDEND GROWTH
          • Dividend Growth Portfolio
          • Dividend Calendar
        • DOGS OF THE DOW
          • Dogs of the Dow Portfolio
          • DOW 5 Portfolio
  • Markets
        • US MARKET
          • Commodities
          • Energy
          • Precious Metals
          • Volatility
        • GLOBAL MARKETS
          • Market Indices
          • Economic Calendar
          • FOREX Heat Map
          • FOREX Cross Rates
          • Crypto Currency Market
  • Investing
    • Discord Community
    • Dashboard
  • Resources
        • ARTICLES
          • Dividend Growth Model Articles
          • ETF Articles
          • Investment Strategies Articles
          • Market and Economic Insights
          • Stock Trade Articles
          • Stock Reviews
        • TOOLS
          • Stock Scanners
          • Charting Software
          • Brokerage Firms
        • STOCK CHARTS
          • Key Components
          • Reading Charts
          • Drawing Stock Charts
          • Identifying Trends
        • RETIREMENT PLANNING
  • About
    • Contact Us
    • How to Win
    • #1 At Stockcharts
    • Disclaimer
    • FAQ
  • Log In
  • Subscribe

February 22, 2020

Green Line Weekly Feb 22, 2020

NYSE Chart
The weak Energy Stocks are hurting the broad NYSE Index.


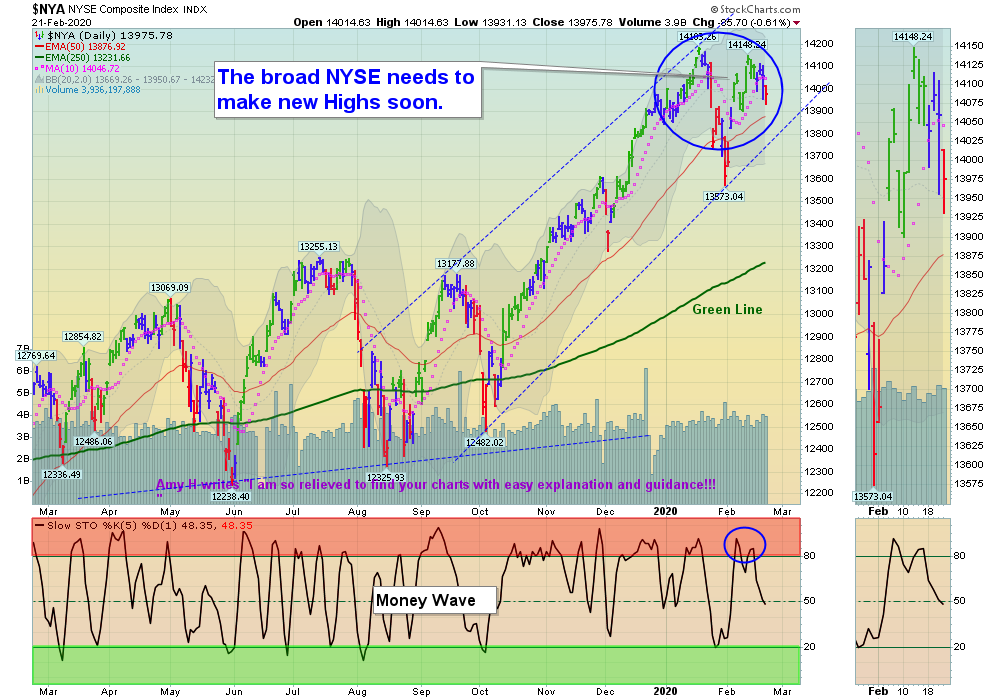
02/22/2020:  Markets were down for the week as the weaker Indices (Small Caps, NYSE & Transports) could not make Higher Highs. The lack of new Buying caused some profit taking to come in. The S&P 500, DOW 30, and NASDAQ 100 Indices were able to make New Highs, which is Bullish. The Leaders and Indices are still Way Above the Green Lines, but are finally coming down towards the Green Zones for Money Wave Buys soon.

It is rare for Bonds and Gold to be making highs together this week. Investors are very confused. The CNN Greed Index is down to 44.

New Subscribers:  The Leaders and strongest Indices are quickly coming down from the Red Zones.  Please be patient and WAIT for Green Zone Buys again. 

For the week the Dow was down 1.36%, the S&P 500 was down 1.22%, and the Nasdaq 100 was down 1.86%.  The Long Term Trend on the Stock Markets is UP. 


The Inflation Index (CRB) was up 0.98% and is Below the Green Line, indicating Economic Weakness.

Bonds  were up 2.41% for the week and are Above the Green Line, indicating Economic Weakness.

The US DOLLAR was up 0.26% for the week and made New Highs. 

Crude Oil was up 2.56% for the week at $53.38, and GOLD was up 3.93%  at $1648.80, a 1 year High.

_____________________________________________________________________________________________

MONEY WAVE BUYS SOON:   

We are currently in 1 logged Open Positions, for the Short & Medium Term.  There are 5 Investments on the Short Term Watch List. 

Be patient and WAIT for Green Zone Buy Signals!

______________________________________________________________________________________________

LONG TERM INVESTMENTS 

Buy the Leading Investments that are down near the weekly Green Zones.     

AG     FIRST MAJESTIC SILVER      Buy if it Closes above the Red Line of $10.30 on High Volume.

ARWR     ARROWHEAD PHARMA.     Buy if it Closes above $46.42 on High Volume.      

CYH     COMMUNITY HEALTH SYSTEMS     Broke Out above $4.90. Buy on the next Daily Money Wave Buy Signal.   

DB     DEUTSCHE BANK     Buy on the next Daily Money Wave Buy Signal soon.   

GDX     GOLD MINERS FUND      Buy if it Closes above $31.06 on High Volume. 

GE     GENERAL ELECTRIC CORP.     Buy on the next Daily Money Wave Buy Signal soon.   

NWL    NEWELL BRANDS      Buy if it Closes above $20.84 on High Volume.   


______________________________________________________________________________________

Click for  Portfolio (Open Positions)
Click for  Watch List
Click for  Closed Positions


New ETF Sector Rotation System

Dogs of the DOW System

Long Term Strategy for IRAs & 401k Plans:   Currently invested in all 4 Funds. 

Alert! Market Risk is HIGH (Red Zone). The probability of successful Short Term Trades is better, when the % of stocks above the 50-day avg. is below 20. 

Tell your Friends about the Green Line, and Help Animals

___________________________________________________________________________________________

QUESTION:  Alberto writes “AGL:   Little question: what does the green dot on the portfolios holdings mean? Thank you.”

ANSWER:  Hi Roberto, please click on the Symbol Link for a Daily Chart, and on the Green Dot to see the 60-min Chart of the Investment.

Good trading, and tell your friends!

AGL

Related Post

– Green Line Weekly Feb 16, 2020

Subscribe to Our Newsletter

AGL Logo

Get our eBook Now!

Candlestick - A Swing Traders Friend

We don’t spam! Read our privacy policy for more info.

You’ve been successfully subscribed to our newsletter!

Voted #1 at Stock Charts

SH Chart
Inverse S&P 500 Fund (SH) will have a Money Wave Buy today.

Help Us Help Animals

Help Us Help Animals

Recent Comments

  • Market Breadth Indicators: A Trader’s Guide to Early Trend Detection on Backtesting: Definition and How a Trading Strategy Backtest Works
  • Island Reversal Pattern: Definition and Formation Explained on Double Top Pattern: How to Identify and Trade This Reversal Signal
  • Channel Pattern Guide: What It Is and Why It Matters on A Guide to Forecasting Using Moving Averages
  • What Is a Broadening Bottom Chart Pattern? Full Guide on Bull vs. Bear Market: An Investor’s Guide to Market Phases
  • ATGL Weekly Money Flow - 2025-05-11 on ATGL Top Pick of the Week! Apr 6, 2025

Become a Green Liner!

Help me make more Money in the Stock Market.

ON ATGL

  • DashBoard
  • Weekly Commentary
  • Daily Buy / Sell Signals
  • Day Trade Setup
  • Trading Rooms

Design & Develop By Pixelvect

STRATEGIES

  • Swing Trading
  • ATGL Pick of the Week
  • Dividend Growth
  • ETF Sector Rotation
  • Dogs of the Dow

HELP

  • ATGL Trading Rules
  • FAQ
  • Account Maintenance
  • Contact US
  • Join

FOLLOW US

Instagram Linkedin Twitter Facebook

© COPYRIGHT 2024 · ABOVETHEGREENLINE.COM · ALL RIGHTS RESERVED · PRIVACY · TERMS · CONTACT · WATCHLIST · CURRENT