By ATGL
Updated March 12, 2026
Swing trading can be a great way to use short-term market movements to generate profits. Despite its growing popularity, however, this form of trading is not for everyone. If you’re wondering whether swing trading is the best strategy for you, it’s important to know that this style of trading depends on timing your trades according to price movements over days and weeks. Trading indicators facilitate forecasting price movements and gauging market conditions, which can help decide the opportune time to execute trades.
Swing trading indicators represent just one component of a broader market approach. Investors exploring how different methods—such as swing trading, long-term investing, and rules-based strategies—fit into portfolio construction can learn more in the Investment Strategy Guide, which explains how investors align strategies, risk tolerance, and time horizons to build disciplined investment plans.
Here are the best indicators for swing trading that you should be watching in 2024.
8 Swing Trading Indicators To Keep Track of in 2024
While every trade requires a degree of background knowledge and research, it is easy to get overwhelmed by all the available information. Since swing trading is based on short- and medium-term trades, factors and trend indicators that affect pricing over that time horizon are what you must focus on. It is, therefore, important to consider the differences between fundamental analysis and technical analysis to ensure your research is relevant.
Technical indicators are based on technical analysis while fundamental analysis is used to calculate broader economic indicators. The key to using indicators efficiently is to follow the ones that will help you gauge the market according to your trading goals, risk tolerance, and trading style.
1. Moving Averages (MA)
A moving average shows the average price of an asset over a certain period of time. This technical indicator can help with gauging the direction and strength with which prices are moving as well as areas of support and resistance. Popular moving average measures used by traders are 50-day, 100-day, and 200-day MA.
Different types of moving averages include:
- Simple Moving Averages (SMA)
- Exponential Moving Averages (EMA)
- Moving Average Convergence Divergence (MACD)
2. Stochastic Oscillator
The stochastic oscillator is an indicator that can help you decide when to buy or sell a certain stock. It is derived using the closing price of a commodity or stock on a certain day, as well as the highest and lowest closing prices within a certain period of time. If the stochastic oscillator value is too high, it indicates that the stock is overbought and is, therefore, trading at a price that’s higher than its intrinsic value. At this point, it is a good idea to consider selling the stock. Similarly, a low stochastic oscillator value could mean the stock is oversold, meaning it could be an opportune moment to buy.
3. On-Balance Volume (OBV)
This indicator uses trading volumes to measure how much pressure there is on a particular stock’s price movements. If the OBV value moves up steadily, it may indicate that the stock price will also rise because it is being traded more. Conversely, a falling OBV value can foretell a fall in a stock’s price.
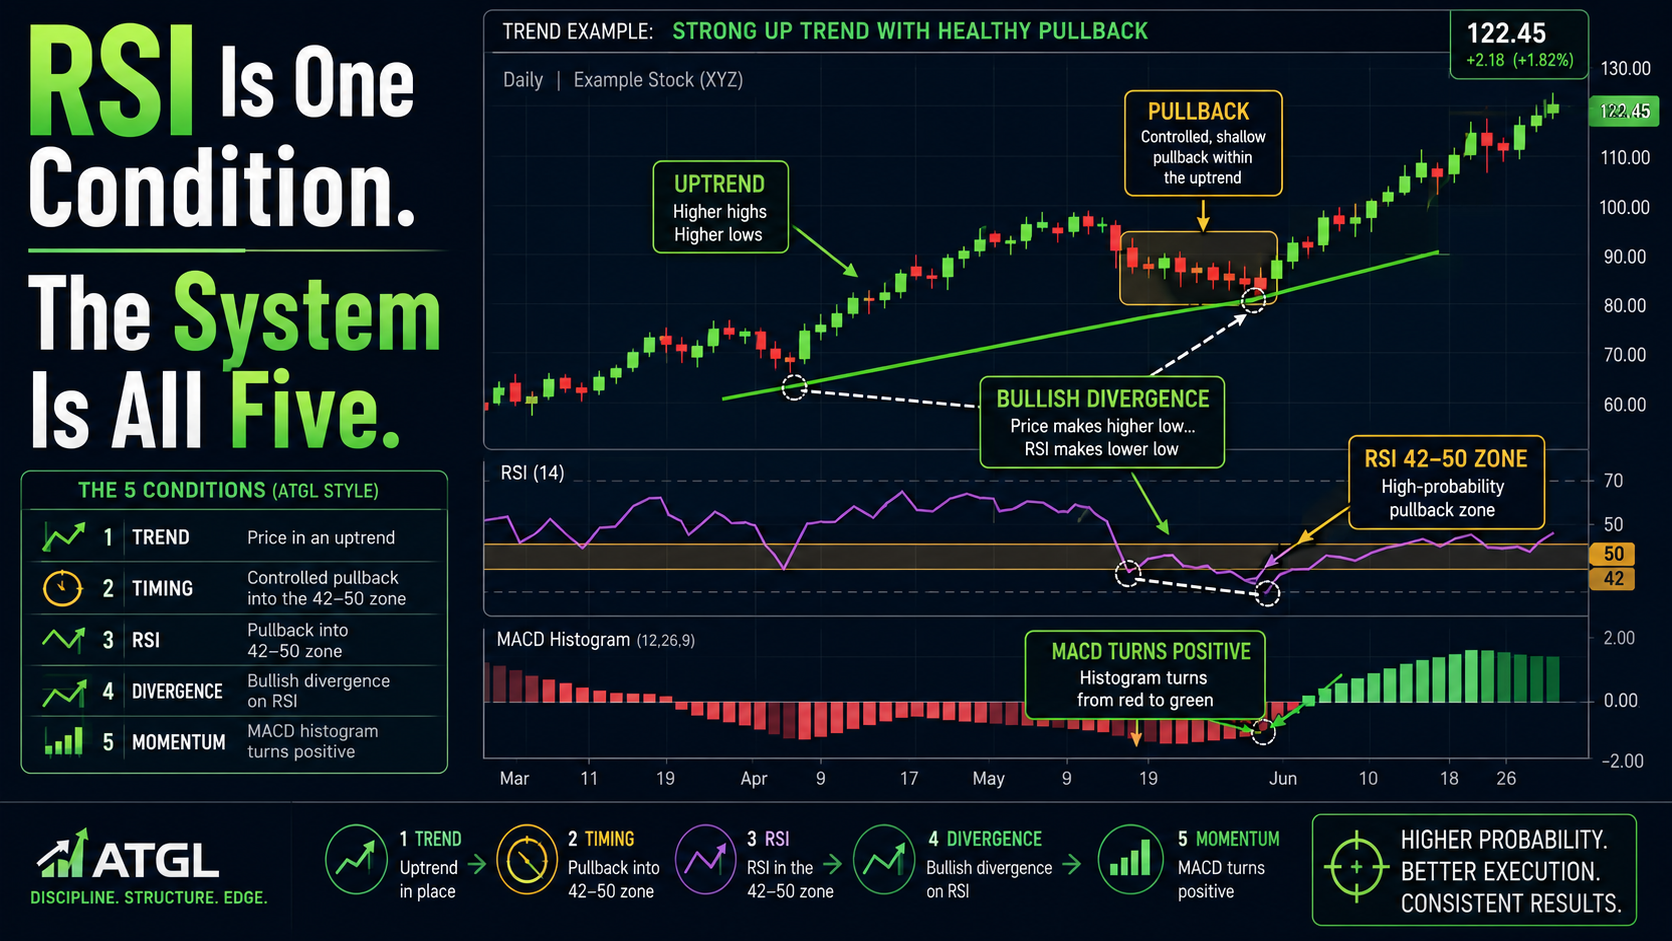
4. Relative Strength Index (RSI)
Introduced by J. Welles Wilder Jr. in his seminal 1978 book, New Concepts in Technical Trading Systems, the RSI is an oscillating indicator that’s used to measure the speed and magnitude of a particular stock or asset’s price movements. This indicator ranges from 0 to 100. A value of 30 or below indicates that the stock is oversold and, therefore, a potentially good buy. RSI values above 70 indicate the stock is overvalued and that it may be a good time to sell.
5. Bollinger Bands (BB)
Bollinger Bands are trendlines or “bands” placed one standard deviation above and below the average price or SMA of a stock price. Developed by technical analyst and trader John Bollinger in the 1980s, these bands help determine the volatility and trend of the price in the short term. Narrow bands indicate low volatility while broader bands signal higher volatility. Since low and high volatility periods generally alternate, it can help you time your trades. Additionally, a price going above or below a band can indicate that the stock is overbought or oversold, respectively.
When used correctly, BB is one of the best indicators for swing trading. This is because it lets you forecast the volatility of a stock’s price as well as determine whether it is trading at, above, or below its intrinsic value. Whether you’re using buy-and-hold or market-timing trading strategies, this indicator offers valuable insights.
6. Accumulative Swing Index
This indicator is a relatively broad index that provides insight into a stock’s price by taking into consideration its opening, closing, high, and low prices. It can help you gauge the trend of a particular stock’s price swings in the medium and long term, resulting in stronger swing trading analysis.
7. Average True Range (ATR)
ATR gauges market volatility by considering the movement of stock prices over a specific period. This period is generally 14 days but can be modified to suit a swing trader’s needs. Longer periods will tend to show less volatility. Conversely, shorter periods can show higher volatility, and therefore, more swing trading signals.
8. Fibonacci Retracement
Fibonacci retracement indicators are represented as horizontal bars on a stock’s price chart and help determine support and resistance levels. The bars are placed at 0.0%, 23.6%, 38.2%, 50%, 61.8%, and 100%, which don’t necessarily correspond to Fibonacci numbers, but are levels that are considered consequential for traders. These Fibonacci bars can be placed in sections of the price chart that specifically require consideration and can help indicate when the price will retrace its path before continuing its broader trend. Depending on whether the price is going up or down, this can help determine buying or selling opportunities.
Perfect Your Swing Trading Strategy With Above the Green Line
Above the Green Line helps you trade using the combined benefits of the best stock indicators for swing trading as well as time-tested trading rules which can help you perfect your swing trading strategy. Sign up for a membership to make use of our swing trading tools and get real-time alerts based on our expert swing trading technical analysis.

Related Articles
[pt_view id=”b1ac254g2i”]