Above the Green Line -01
  • Market Insights
        • Commentary
          • Daily
          • Weekly
        • BUY / SELL SIGNALS
          • Trade Posts
          • Recent Trade Alerts
          • Recent Day Trades
        • BLOGROLL
          • Dividend Growth Blog
          • ETF Sector Blog
          • Dow Dogs
          • TPOW Blog
  • Strategies
        • SWING TRADING
          • Current Positions
          • Watchlists
          • Closed Positions
          • Candidates - TOP 100
          • Specialty Stocks
        • WEEKLY STOCK PICK
          • TPOW Charts
          • TPOW Performance
          • TPOW Strategy Guide
          • TPOW Performance Dashboard
        • DAY TRADING
          • Watch List
        • ATGL DASHBOARD
        • ETF STRATEGIES
          • ETF Sector Rotation
          • ETF Sector Portfolio
        • DIVIDEND GROWTH
          • Dividend Growth Portfolio
          • Dividend Calendar
        • DOGS OF THE DOW
          • Dogs of the Dow Portfolio
          • DOW 5 Portfolio
  • Markets
        • US MARKET
          • Commodities
          • Energy
          • Precious Metals
          • Volatility
        • GLOBAL MARKETS
          • Market Indices
          • Economic Calendar
          • FOREX Heat Map
          • FOREX Cross Rates
          • Crypto Currency Market
  • Investing
    • Discord Community
    • Dashboard
  • Resources
        • ARTICLES
          • Dividend Growth Model Articles
          • ETF Articles
          • Investment Strategies Articles
          • Market and Economic Insights
          • Stock Trade Articles
          • Stock Reviews
        • TOOLS
          • Stock Scanners
          • Charting Software
          • Brokerage Firms
        • STOCK CHARTS
          • Key Components
          • Reading Charts
          • Drawing Stock Charts
          • Identifying Trends
        • RETIREMENT PLANNING
  • About
    • Contact Us
    • How to Win
    • #1 At Stockcharts
    • Disclaimer
    • FAQ
  • Log In
  • Subscribe

Archives for March 2019

March 7, 2019

Money Wave Alert! Mar 7, 2019

DIA Chart

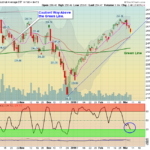
  Markets were down again today as the S&P 500 broke below the Support of 2764. Next Support is the Red Line (50-day avg.) of  2715.  The Leaders are slowly returning  back down to the Green Zones for Money Wave Buy Signals soon. The … [Read more...]

March 6, 2019

Money Wave Alert! Mar 6, 2019

SPX Chart

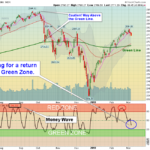
  Markets were down today as the Leaders are slowly returning  back down to the Green Zones for Money Wave Buy Signals soon. The best trades usually happen when the S&P 500 Index is also coming up out of the Green Zone.  Support on the  … [Read more...]

March 5, 2019

Money Wave Alert! Mar 5, 2019

Watch Chart

  Markets were mixed today as many Investors don't have a reason to Sell after yesterday's drop. Support on the  S&P 500 is 2764. The Leaders are quickly coming down from the Red Zones for Money Wave Buy Signals soon. Please be … [Read more...]

March 4, 2019

Money Wave Alert! Mar 4, 2019

DIA Chart

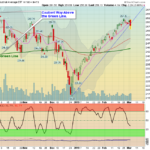
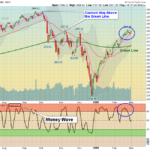
  Markets were down today as several Indices slipped below the Pink Lines (10-day avgs.) to create Short Term Sell Signals. Support on the  S&P 500 is 2764. The Leaders are quickly coming down from the Red Zones for Money Wave Buy … [Read more...]

March 3, 2019

Green Line Weekly Mar 3, 2019

Stage Chart

  03/03/2019:  Markets were up slightly for the week, but the buying Volume has slowed down.  Stocks are saying that the Economy is good, and Bonds and Commodities are saying the Economy is weak. Somebody is WRONG. We like to Buy during … [Read more...]

March 1, 2019

Money Wave Alert! Mar 1, 2019

SPX Chart

  Markets were up today and the S&P 500 was able to bounce up from the Pink Line (10-day avg.) of 2787 to avoid a Short Term Sell Signal. Now the S&P 500 needs to exceed Monday's high of 2813. Markets are over-bought again, as many … [Read more...]

  • « Previous Page
  • 1
  • 2
  • 3

Subscribe to Our Newsletter

AGL Logo

Get our eBook Now!

Candlestick - A Swing Traders Friend

We don’t spam! Read our privacy policy for more info.

You’ve been successfully subscribed to our newsletter!

Voted #1 at Stock Charts

SH Chart
Inverse S&P 500 Fund (SH) will have a Money Wave Buy today.

Help Us Help Animals

Help Us Help Animals

Recent Comments

  • Market Breadth Indicators: A Trader’s Guide to Early Trend Detection on Backtesting: Definition and How a Trading Strategy Backtest Works
  • Island Reversal Pattern: Definition and Formation Explained on Double Top Pattern: How to Identify and Trade This Reversal Signal
  • Channel Pattern Guide: What It Is and Why It Matters on A Guide to Forecasting Using Moving Averages
  • What Is a Broadening Bottom Chart Pattern? Full Guide on Bull vs. Bear Market: An Investor’s Guide to Market Phases
  • ATGL Weekly Money Flow - 2025-05-11 on ATGL Top Pick of the Week! Apr 6, 2025

Become a Green Liner!

Help me make more Money in the Stock Market.

ON ATGL

  • DashBoard
  • Weekly Commentary
  • Daily Buy / Sell Signals
  • Day Trade Setup
  • Trading Rooms

Design & Develop By Pixelvect

STRATEGIES

  • Swing Trading
  • ATGL Pick of the Week
  • Dividend Growth
  • ETF Sector Rotation
  • Dogs of the Dow

HELP

  • ATGL Trading Rules
  • FAQ
  • Account Maintenance
  • Contact US
  • Join

FOLLOW US

Instagram Linkedin Twitter Facebook

© COPYRIGHT 2024 · ABOVETHEGREENLINE.COM · ALL RIGHTS RESERVED · PRIVACY · TERMS · CONTACT · WATCHLIST · CURRENT