Above the Green Line -01
  • Market Insights
        • Commentary
          • Daily
          • Weekly
        • BUY / SELL SIGNALS
          • Trade Posts
          • Recent Trade Alerts
          • Recent Day Trades
        • BLOGROLL
          • Dividend Growth Blog
          • ETF Sector Blog
          • Dow Dogs
          • TPOW Blog
  • Strategies
        • SWING TRADING
          • Current Positions
          • Watchlists
          • Closed Positions
          • Candidates - TOP 100
          • Specialty Stocks
        • WEEKLY STOCK PICK
          • TPOW Charts
          • TPOW Performance
          • TPOW Strategy Guide
          • TPOW Performance Dashboard
        • DAY TRADING
          • Watch List
        • ATGL DASHBOARD
        • ETF STRATEGIES
          • ETF Sector Rotation
          • ETF Sector Portfolio
        • DIVIDEND GROWTH
          • Dividend Growth Portfolio
          • Dividend Calendar
        • DOGS OF THE DOW
          • Dogs of the Dow Portfolio
          • DOW 5 Portfolio
  • Markets
        • US MARKET
          • Commodities
          • Energy
          • Precious Metals
          • Volatility
        • GLOBAL MARKETS
          • Market Indices
          • Economic Calendar
          • FOREX Heat Map
          • FOREX Cross Rates
          • Crypto Currency Market
  • Investing
    • Discord Community
    • Dashboard
  • Resources
        • ARTICLES
          • Dividend Growth Model Articles
          • ETF Articles
          • Investment Strategies Articles
          • Market and Economic Insights
          • Stock Trade Articles
          • Stock Reviews
        • TOOLS
          • Stock Scanners
          • Charting Software
          • Brokerage Firms
        • STOCK CHARTS
          • Key Components
          • Reading Charts
          • Drawing Stock Charts
          • Identifying Trends
        • RETIREMENT PLANNING
  • About
    • Contact Us
    • How to Win
    • #1 At Stockcharts
    • Disclaimer
    • FAQ
  • Log In
  • Subscribe

Archives for October 2018

October 8, 2018

Money Wave Alert! Oct 8, 2018

QQQ Chart

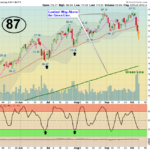
  Markets  were mixed today after dumping this morning, but the S&P 500 held the Support of 2872 again and Bounced.  Some of the Leaders have become very Over-Sold on the short term as FEAR has picked up. Now the Buying must come in, … [Read more...]

October 7, 2018

Green Line Weekly Oct 7, 2018

IWM Chart

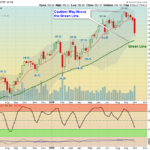
  10/07/2018:  Markets were down for the week, as the Leaders were over-bought and in the Red Zones. Now the Indices are returning back down to the Green Zones, for Money Wave Buys soon. For the week the Dow was down 0.04%, the S&P 500 … [Read more...]

October 5, 2018

Money Wave Alert! Oct 5, 2018

SPX Chart

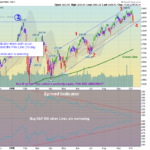
  Markets  were down again today, but the S&P 500 went down to the Support of 2872 and Bounced.  Now the Buying must come in, or Traders could become Frustrated. The Strongest Leaders are finally correcting down enough for better Money … [Read more...]

October 4, 2018

Money Wave Alert! Oct 4, 2018

SPX Chart

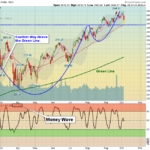
  Markets  dropped today, as the S&P 500 could not exceed the September Highs (Double Top) and sold off. The DOW Index made New Highs recently, but not much else. Now some of the Leaders are correcting down enough for better Money Wave … [Read more...]

October 3, 2018

Money Wave Alert! Oct 3, 2018

TYX Chart

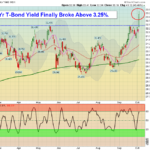
  Markets  were mixed today, with the DOW Index making New Highs but not much else. Bonds dumped as the 30 year T-Bond Yield broke the 3.25% Rate today. The major Indices are going up to re-test the recent Highs. Please wait for Money … [Read more...]

October 2, 2018

Money Wave Alert! Oct 2, 2018

XRT Chart

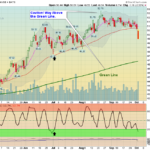
  Markets  were mostly up today, but the Money is rolling out of Retail and Small Caps and into Large Blue Chips like the 30 DOW Stocks. The DOW Index made a New High today, which is masking the internal weakness of the Markets. The major … [Read more...]

October 1, 2018

Money Wave Alert! Oct 1, 2018

DIA Chart

  Markets  "Gapped Up" today on Good News but lower Volume.  The major Indices are going up to re-test the recent Highs. Please wait for Money Wave Buy Signals below. The breadth of the Markets has become narrow, indicating lack of Buyers. … [Read more...]

  • « Previous Page
  • 1
  • 2
  • 3

Subscribe to Our Newsletter

AGL Logo

Get our eBook Now!

Candlestick - A Swing Traders Friend

We don’t spam! Read our privacy policy for more info.

You’ve been successfully subscribed to our newsletter!

Voted #1 at Stock Charts

SH Chart
Inverse S&P 500 Fund (SH) will have a Money Wave Buy today.

Help Us Help Animals

Help Us Help Animals

Recent Comments

  • Market Breadth Indicators: A Trader’s Guide to Early Trend Detection on Backtesting: Definition and How a Trading Strategy Backtest Works
  • Island Reversal Pattern: Definition and Formation Explained on Double Top Pattern: How to Identify and Trade This Reversal Signal
  • Channel Pattern Guide: What It Is and Why It Matters on A Guide to Forecasting Using Moving Averages
  • What Is a Broadening Bottom Chart Pattern? Full Guide on Bull vs. Bear Market: An Investor’s Guide to Market Phases
  • ATGL Weekly Money Flow - 2025-05-11 on ATGL Top Pick of the Week! Apr 6, 2025

Become a Green Liner!

Help me make more Money in the Stock Market.

ON ATGL

  • DashBoard
  • Weekly Commentary
  • Daily Buy / Sell Signals
  • Day Trade Setup
  • Trading Rooms

Design & Develop By Pixelvect

STRATEGIES

  • Swing Trading
  • ATGL Pick of the Week
  • Dividend Growth
  • ETF Sector Rotation
  • Dogs of the Dow

HELP

  • ATGL Trading Rules
  • FAQ
  • Account Maintenance
  • Contact US
  • Join

FOLLOW US

Instagram Linkedin Twitter Facebook

© COPYRIGHT 2024 · ABOVETHEGREENLINE.COM · ALL RIGHTS RESERVED · PRIVACY · TERMS · CONTACT · WATCHLIST · CURRENT