Above the Green Line -01
  • Market Insights
        • Commentary
          • Daily
          • Weekly
        • BUY / SELL SIGNALS
          • Trade Posts
          • Recent Trade Alerts
          • Recent Day Trades
        • BLOGROLL
          • Dividend Growth Blog
          • ETF Sector Blog
          • Dow Dogs
          • TPOW Blog
  • Strategies
        • SWING TRADING
          • Current Positions
          • Watchlists
          • Closed Positions
          • Candidates - TOP 100
          • Specialty Stocks
        • WEEKLY STOCK PICK
          • TPOW Charts
          • TPOW Performance
          • TPOW Strategy Guide
          • TPOW Performance Dashboard
        • DAY TRADING
          • Watch List
        • ATGL DASHBOARD
        • ETF STRATEGIES
          • ETF Sector Rotation
          • ETF Sector Portfolio
        • DIVIDEND GROWTH
          • Dividend Growth Portfolio
          • Dividend Calendar
        • DOGS OF THE DOW
          • Dogs of the Dow Portfolio
          • DOW 5 Portfolio
  • Markets
        • US MARKET
          • Commodities
          • Energy
          • Precious Metals
          • Volatility
        • GLOBAL MARKETS
          • Market Indices
          • Economic Calendar
          • FOREX Heat Map
          • FOREX Cross Rates
          • Crypto Currency Market
  • Investing
    • Discord Community
    • Dashboard
  • Resources
        • ARTICLES
          • Dividend Growth Model Articles
          • ETF Articles
          • Investment Strategies Articles
          • Market and Economic Insights
          • Stock Trade Articles
          • Stock Reviews
        • TOOLS
          • Stock Scanners
          • Charting Software
          • Brokerage Firms
        • STOCK CHARTS
          • Key Components
          • Reading Charts
          • Drawing Stock Charts
          • Identifying Trends
        • RETIREMENT PLANNING
  • About
    • Contact Us
    • How to Win
    • #1 At Stockcharts
    • Disclaimer
    • FAQ
  • Log In
  • Subscribe

Archives for June 2017

June 7, 2017

Money Wave Alert! Jun 7, 2017

USO Chart

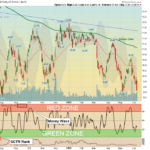
  The Markets are up slightly today, with the Semiconductors & the very Strongest Techs are still pushing higher. The S&P 500 is trying to bounce off the Pink Line (10-day avg.) to avoid a Short Term Sell Signal, as Crude Oil is … [Read more...]

June 6, 2017

Money Wave Alert! Jun 6, 2017

XLK Chart

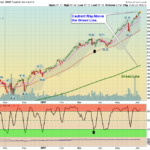
  The Markets are down slightly today, but the very Strongest Techs are still pushing higher. The S&P 500 has not been up today. Only the Market Darlings seem to have much Buying left at these levels. Traders, RAISE Cash so you will … [Read more...]

June 5, 2017

Money Wave Alert! Jun 5, 2017

SPX Chart

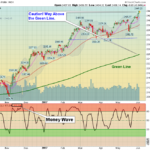
  The Markets are mixed today, after last week's rally. The very Strongest Techs are still pushing slightly higher. The S&P 500 has not been up today.  The Markets have no FEAR, therefore no Sellers as confidence levels are super … [Read more...]

June 4, 2017

Weekly Commentary Jun 4, 2017

SPY Chart

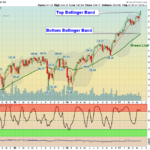
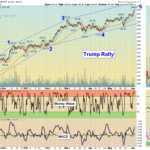
  06/04/2017:  Markets were up again for the week, as momentum pushed the Indices higher. Next week Congress returns, which could put a damper on the enthusiasm. The weekly S&P 500 Chart (see Chart above) closed above the Top Bollinger … [Read more...]

June 2, 2017

Money Wave Alert! Jun 2, 2017

SPY Chart

  The Markets are higher again today, and all of the major Indices are participating on lower Volume. The very Strongest Techs are Blowing Out! The S&P 500 made a Higher high today of 2440.  The Markets have no FEAR, therefore no … [Read more...]

June 1, 2017

Money Wave Alert! June 1, 2017

MCD Chart

A few Darlings are still going higher!  The Markets popped up today, but the very Strongest Techs are not participating in today's rally. The S&P 500 corrected down to 2404 yesterday, and has exceeded last Thursday's High of 2419.  The … [Read more...]

  • « Previous Page
  • 1
  • 2
  • 3

Subscribe to Our Newsletter

AGL Logo

Get our eBook Now!

Candlestick - A Swing Traders Friend

We don’t spam! Read our privacy policy for more info.

You’ve been successfully subscribed to our newsletter!

Voted #1 at Stock Charts

SH Chart
Inverse S&P 500 Fund (SH) will have a Money Wave Buy today.

Help Us Help Animals

Help Us Help Animals

Recent Comments

  • Market Breadth Indicators: A Trader’s Guide to Early Trend Detection on Backtesting: Definition and How a Trading Strategy Backtest Works
  • Island Reversal Pattern: Definition and Formation Explained on Double Top Pattern: How to Identify and Trade This Reversal Signal
  • Channel Pattern Guide: What It Is and Why It Matters on A Guide to Forecasting Using Moving Averages
  • What Is a Broadening Bottom Chart Pattern? Full Guide on Bull vs. Bear Market: An Investor’s Guide to Market Phases
  • ATGL Weekly Money Flow - 2025-05-11 on ATGL Top Pick of the Week! Apr 6, 2025

Become a Green Liner!

Help me make more Money in the Stock Market.

ON ATGL

  • DashBoard
  • Weekly Commentary
  • Daily Buy / Sell Signals
  • Day Trade Setup
  • Trading Rooms

Design & Develop By Pixelvect

STRATEGIES

  • Swing Trading
  • ATGL Pick of the Week
  • Dividend Growth
  • ETF Sector Rotation
  • Dogs of the Dow

HELP

  • ATGL Trading Rules
  • FAQ
  • Account Maintenance
  • Contact US
  • Join

FOLLOW US

Instagram Linkedin Twitter Facebook

© COPYRIGHT 2024 · ABOVETHEGREENLINE.COM · ALL RIGHTS RESERVED · PRIVACY · TERMS · CONTACT · WATCHLIST · CURRENT