Above the Green Line -01
  • Market Insights
        • Commentary
          • Daily
          • Weekly
        • BUY / SELL SIGNALS
          • Trade Posts
          • Recent Trade Alerts
          • Recent Day Trades
        • BLOGROLL
          • Dividend Growth Blog
          • ETF Sector Blog
          • Dow Dogs
          • TPOW Blog
  • Strategies
        • SWING TRADING
          • Current Positions
          • Watchlists
          • Closed Positions
          • Candidates - TOP 100
          • Specialty Stocks
        • WEEKLY STOCK PICK
          • TPOW Charts
          • TPOW Performance
          • TPOW Strategy Guide
          • TPOW Performance Dashboard
        • DAY TRADING
          • Watch List
        • ATGL DASHBOARD
        • ETF STRATEGIES
          • ETF Sector Rotation
          • ETF Sector Portfolio
        • DIVIDEND GROWTH
          • Dividend Growth Portfolio
          • Dividend Calendar
        • DOGS OF THE DOW
          • Dogs of the Dow Portfolio
          • DOW 5 Portfolio
  • Markets
        • US MARKET
          • Commodities
          • Energy
          • Precious Metals
          • Volatility
        • GLOBAL MARKETS
          • Market Indices
          • Economic Calendar
          • FOREX Heat Map
          • FOREX Cross Rates
          • Crypto Currency Market
  • Investing
    • Discord Community
    • Dashboard
  • Resources
        • ARTICLES
          • Dividend Growth Model Articles
          • ETF Articles
          • Investment Strategies Articles
          • Market and Economic Insights
          • Stock Trade Articles
          • Stock Reviews
        • TOOLS
          • Stock Scanners
          • Charting Software
          • Brokerage Firms
        • STOCK CHARTS
          • Key Components
          • Reading Charts
          • Drawing Stock Charts
          • Identifying Trends
        • RETIREMENT PLANNING
  • About
    • Contact Us
    • How to Win
    • #1 At Stockcharts
    • Disclaimer
    • FAQ
  • Log In
  • Subscribe

Archives for March 2017

March 8, 2017

Money Wave Alert! Mar 8, 2017

Chart

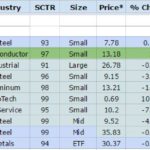
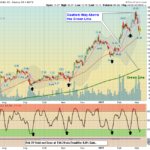
  The Markets  are down slightly today, as Crude Oil has dumped  over 5%.  The Indices are still holding up very well, even with some Indices falling Below the Pink Lines (10-day avgs.)  and creating Short Term Sell Signals.  Looks like the … [Read more...]

March 7, 2017

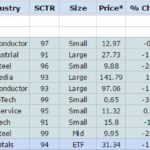
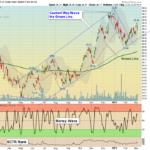
Money Wave Alert! Mar 7, 2017

AMD Chart

  The Markets  are mixed today, as the Indices are still struggling to stay Above the Pink Lines (10-day avgs.)  and avoid Short Term Sell Signals.  Looks like the DOW wants to try the Highs again, soon. Money Wave Buys are not going up … [Read more...]

March 6, 2017

Money Wave Alert! Mar 6, 2017

Chart

  The Markets  are down slightly today, as the Indices are struggling to stay Above the Pink Lines (10-day avgs.)  and avoid Short Term Sell Signals.   The NASDAQ 100 is currently the Strongest major Index. When the NASDAQ 100 returns down … [Read more...]

March 5, 2017

Weekly Commentary Mar 5, 2017

Dollar Chart

  03/05/2017:  Markets were up over 1/2% for the week, as the Indices were able to bounce again at the Pink Lines (10-day avgs.) Falling Below the Pink Lines should create Short Term Sell Signals. The Indices are very over-bought, and are … [Read more...]

March 3, 2017

Money Wave Alert! Mar 3, 2017

EWZ Chart

    The Markets  are mixed today, after filling more of  the "GAP UP" from Wednesday's panic buying. The Indices are still Above the Pink Lines (10-day avgs.)   which avoids Short Term Sell Signals.   The NASDAQ 100 is … [Read more...]

March 2, 2017

Money Wave Alert! Mar 2, 2017

NAZ Chart

  The Markets  are down slightly today, trying to fill the "GAP UP" from yesterday's panic buying. The Indices are Above the Pink Lines (10-day avgs.)   which avoids Short Term Sell Signals.   The NASDAQ 100 is currently the Strongest … [Read more...]

March 1, 2017

Money Wave Alert! Mar 1, 2017

Dow Chart

  The Markets "Gapped Up" today, as the Indices bounced at the Pink Lines (10-day avgs.)  to avoid Short Term Sell Signals.   Why is Tammy "Panic Buying"? Is Trump Superman? Has Tammy forgotten that the FED should raise Interest Rates on … [Read more...]

  • « Previous Page
  • 1
  • 2
  • 3

Subscribe to Our Newsletter

AGL Logo

Get our eBook Now!

Candlestick - A Swing Traders Friend

We don’t spam! Read our privacy policy for more info.

You’ve been successfully subscribed to our newsletter!

Voted #1 at Stock Charts

SH Chart
Inverse S&P 500 Fund (SH) will have a Money Wave Buy today.

Help Us Help Animals

Help Us Help Animals

Recent Comments

  • Market Breadth Indicators: A Trader’s Guide to Early Trend Detection on Backtesting: Definition and How a Trading Strategy Backtest Works
  • Island Reversal Pattern: Definition and Formation Explained on Double Top Pattern: How to Identify and Trade This Reversal Signal
  • Channel Pattern Guide: What It Is and Why It Matters on A Guide to Forecasting Using Moving Averages
  • What Is a Broadening Bottom Chart Pattern? Full Guide on Bull vs. Bear Market: An Investor’s Guide to Market Phases
  • ATGL Weekly Money Flow - 2025-05-11 on ATGL Top Pick of the Week! Apr 6, 2025

Become a Green Liner!

Help me make more Money in the Stock Market.

ON ATGL

  • DashBoard
  • Weekly Commentary
  • Daily Buy / Sell Signals
  • Day Trade Setup
  • Trading Rooms

Design & Develop By Pixelvect

STRATEGIES

  • Swing Trading
  • ATGL Pick of the Week
  • Dividend Growth
  • ETF Sector Rotation
  • Dogs of the Dow

HELP

  • ATGL Trading Rules
  • FAQ
  • Account Maintenance
  • Contact US
  • Join

FOLLOW US

Instagram Linkedin Twitter Facebook

© COPYRIGHT 2024 · ABOVETHEGREENLINE.COM · ALL RIGHTS RESERVED · PRIVACY · TERMS · CONTACT · WATCHLIST · CURRENT