Above The Green Line

  • Commentary
    • BUY / SELL SIGNALS
      • Stock Alerts
    • DIVGRO BLOG
    • ETF SECTOR BLOG
    • DOW DOGS BLOG
    • NEWS
    • STOCK IDEAS
  • Strategies
    • SWING TRADING
      • CURRENT POSITIONS
      • WATCHLISTS
      • CLOSED POSITIONS
      • CANDIDATES – TOP 100
      • SPECIALTY STOCKS
    • DAY TRADING
      • Watch List
    • DIVIDEND GROWTH
      • Dividend Growth Portfolio
      • Dividend Calendar
    • DOGS OF THE DOW
      • Dogs of the Dow Portfolio
      • DOW 5 Portfolio
    • ETF SECTOR ROTATION
      • ETF Sector Portfolio
  • Markets
    • US MARKET
      • Commodities
      • Energy
      • Precious Metals
      • Volatility
    • GLOBAL MARKETS
      • MARKET INDICES
      • ECONOMIC CALENDAR
      • FOREX HEAT MAP
      • FOREX CROSS RATES
      • CRYPTOCURRENCY MARKET
    • DASHBOARD
    • IDEAS
  • Investing
    • FORUM
  • Resources
    • ARTICLES
    • WEEKLY STOCK
    • RETIREMENT PLANNING
    • BLOGROLL
    • FAQ
  • About
    • CONTACT US
    • HOW TO WIN
    • #1 AT STOCKCHARTS
  • Log In
  • Subscribe

September 5, 2022

What is a Triple Buy Signal?

Buy Earlier in the Day with a Triple Buy Signal.

Triple Buy

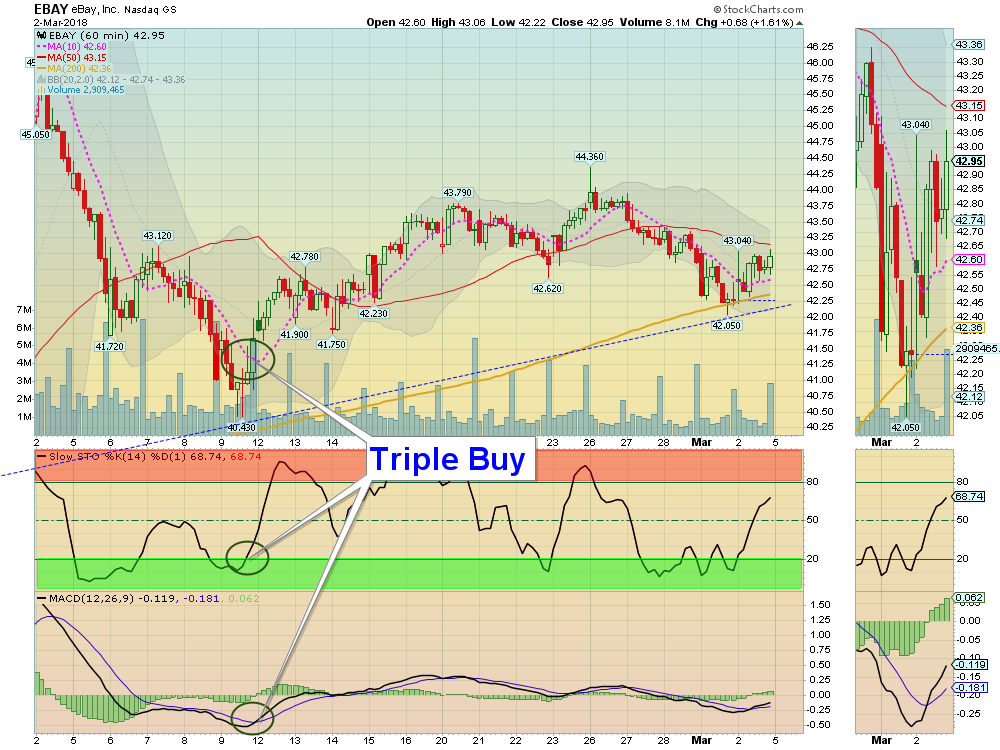
Triple Buy on 60-min Chart.

MARKETS ARE CLOSED TODAY FOR LABOR DAY HOLIDAY.

What is TRIPLE BUY?

When you receive the Daily Money Wave Buy Signal (Money Wave Indicator is going to Close > 20) email near the Close, many times the Investment is already be up 3-6 % before before the Close. So what can be done?

One solution is to shop for a better price earlier in the day. Many traders will go to the 60-min chart to Buy in advance of the Daily Close. Here we will wait for a TRIPLE BUY signal on the 60-min chart. The TRIPLE BUY Signal occurs when 3 Technical Indicators are crossed up for Buy Signals on the 60-min Chart (look for Red Circles to change to Green Circles):

(1. Above Pink Line

2. Above 20 on Money Wave

3. An MCAD Buy).

Use the  TRIPLE BUY only if the Daily Money Wave Chart is going to have a Buy Signal (Close >20 on that day).

These 60-min Charts are here: Daily & Triple Buy Scrolling Charts.

Posted By AbovetheGreenLine at 3:36 pm 2 Comments Tagged With: premium

Comments

  1. vijay2018 says

    September 6, 2022 at 12:14 pm

    All three green circles are not sync. with date line bar still we can buy ?

    Log in to Reply
  2. AbovetheGreenLine says

    September 6, 2022 at 12:20 pm

    Buy when all 3 Circles are Green, and the Volume is High…

    ICLN Chart

    Log in to Reply

Leave a Reply Cancel reply

You must be logged in to post a comment.

Voted #1 at Stock Charts

SH Chart
Inverse S&P 500 Fund (SH) will have a Money Wave Buy today.

Help Us Help Animals

Help Us Help Animals

Recent Comments

  • Money Wave Alert! Mar 29, 2023 – InvFuture Education on Money Wave Alert! Mar 29, 2023
  • Money Wave Alert! Mar 28, 2023 – InvFuture Education on Money Wave Alert! Mar 28, 2023
  • Viking Thera. (VKTX) up 58% today. – InvFuture Education on Viking Thera. (VKTX) up 58% today.
  • Money Wave Alert! Mar 27, 2023 – InvFuture Education on Money Wave Alert! Mar 27, 2023
  • Green Line Weekly! Mar 26, 2023 – InvFuture Education on Green Line Weekly! Mar 26, 2023

Become a Green Liner!

Help me make more Money in the Stock Market.

Above the Green Line

ON ATGL

  • Weekly Commentary
  • Intraday Buy / Sells
  • Day Trade Setup

STRATEGIES

  • Swing Trading
  • Dividend Growth
  • ETF Sector Rotation
  • Dogs of the Dow

HELP

  • ATGL Trading Rules
  • FAQ
  • Account Maintenance
  • Contact US

© Copyright 2021 · AboveTheGreenLine.com · All Rights Reserved · Privacy · Terms · Contact · WatchList · Current