
By ATGL
Updated July 4, 2025
Technical analysis provides traders with systematic approaches to interpreting market movements and price patterns. Among various signals that analysts monitor, moving average crossovers hold particular significance for highlighting potential trend reversals. This guide explores the death cross phenomenon, examining its formation, implications, and practical applications in modern trading.
What Is a Death Cross in Stocks?
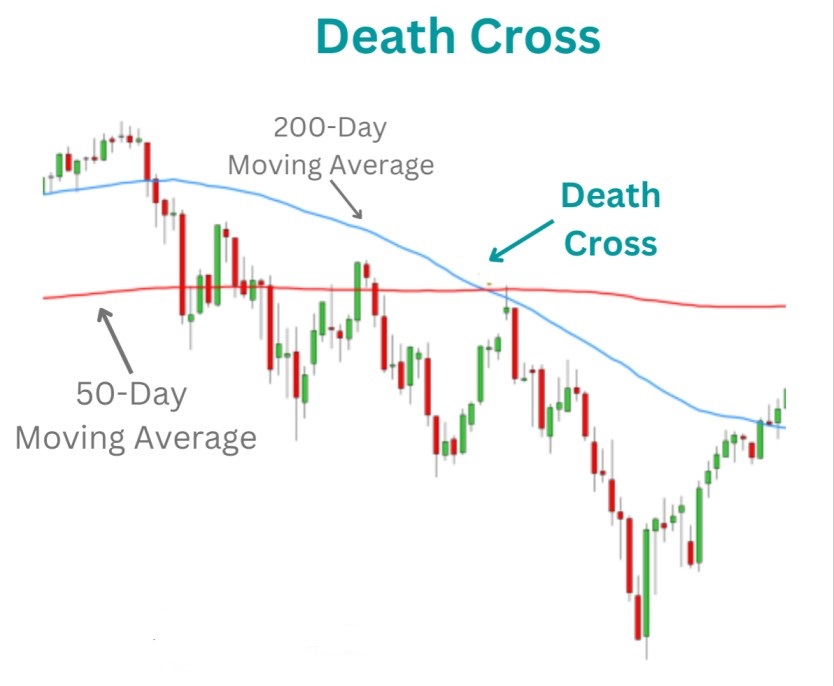
A death cross represents a bearish technical pattern that occurs when a short-term moving average crosses below a long-term moving average. The most commonly monitored version involves the 50-day moving average falling below the 200-day moving average, creating a potential signal of declining momentum.
Moving averages smooth out price fluctuations by calculating the average closing price over a specified period. The 50-day moving average responds more quickly to recent price changes, while the 200-day moving average provides a broader perspective on long-term trends. When the shorter average moves below the longer one, it suggests that recent price performance has weakened relative to the longer-term trend.
The death cross is definitively bearish, indicating that short-term momentum has shifted downward and potentially signaling the beginning of a sustained downtrend. However, this signal represents a lagging indicator rather than a predictive tool, confirming what has already occurred rather than forecasting future movements.
How the Death Cross Forms in the Stock Market
The death cross formation follows a predictable sequence. Initially, both moving averages may trend upward, with the 50-day average positioned above the 200-day average during bullish periods. As selling pressure increases, the 50-day moving average starts to flatten and eventually turns downward.
The crossover occurs when sustained selling pressure causes the 50-day average to intersect and fall below the 200-day average. This intersection marks the official death cross formation. The pattern gains significance when accompanied by increased trading volume, suggesting stronger conviction behind the price movement.
What Does a Death Cross Signal Mean for Traders?
A death cross signifies a potential shift from bullish to bearish market sentiment, historically correlating with periods of increased volatility and declining prices. The signal suggests that recent price performance has deteriorated compared to longer-term trends, potentially indicating the start of a significant downward movement.
The death cross serves as a warning system to reassess positions and risk management strategies. It often coincides with periods when institutional investors begin reducing their equity exposure, contributing to sustained selling pressure.
Historical analysis reveals mixed results regarding accuracy. While death crosses have preceded major market declines, including the 2008 financial crisis and 2020 pandemic selloff, they have also generated false signals during market consolidation periods. The pattern’s effectiveness varies based on market conditions, with stronger predictive value during genuine trend reversals compared to sideways markets.
Notably, death crosses can sometimes be followed by short-term rallies despite their bearish label, particularly when coinciding with oversold conditions. This highlights the importance of using additional confirmation tools rather than relying solely on the death cross signal.
4 Common Mistakes Traders Make With the Death Cross
First, many traders react immediately to death cross formation without waiting for confirmation. Acting on the signal alone often leads to premature entries and unnecessary losses during false breakouts.
Second, traders frequently ignore the broader market environment when interpreting death crosses. A death cross in a strong bull market carries different implications than one occurring during established downtrends.
Third, many investors fail to implement proper risk management when trading death cross signals. Assuming all death crosses lead to significant declines can result in oversized positions and inadequate stop-loss protection.
Fourth, traders often misunderstand the timing aspect of death crosses. As lagging indicators, these signals confirm trends that have already begun rather than predicting future movements.
Trading Strategies Using the Death Cross Stock Market Signal
Professional traders employ various approaches when incorporating death cross signals into their trading plans. The most straightforward strategy involves using the death cross as a confirmation tool for existing bearish bias rather than as a standalone entry signal.
Conservative traders often wait for additional confirmation before acting on death cross signals, monitoring price action after the crossover occurs and looking for sustained movement below key support levels or additional bearish patterns.
More aggressive strategies might involve shorting stocks or indices immediately following death cross formation, particularly when the signal occurs with high volume and clear momentum. Portfolio-based strategies use death cross signals to adjust overall market exposure, potentially reducing equity allocations when multiple death crosses occur across different sectors.
How Pros Confirm the Death Cross Signal Before Making a Move
Professional traders rarely act on death cross signals in isolation. They combine the signal with other technical indicators to build a comprehensive picture of market conditions. Forecasting using moving averages provides additional context for understanding broader trend structure.
Volume analysis plays a crucial role in confirmation. Death crosses accompanied by above-average volume carry more significance than those occurring on light trading. Momentum indicators such as RSI or MACD provide additional confirmation when aligned with the bearish signal.
Support and resistance levels offer another confirmation layer. Death crosses occurring near significant resistance levels or resulting in breaks below important support zones carry increased weight in professional analysis.
Risk Management When Trading a Death Cross
Effective risk management becomes paramount when trading death cross signals due to their potential for generating false signals. Position sizing represents the first line of defense, with professionals risking only a small percentage of their portfolio on any single death cross-based trade.
Stop-loss orders provide essential protection against adverse movements, typically placed above recent resistance levels or the death cross intersection point. Diversification across multiple timeframes and instruments helps reduce the impact of individual false signals.
What Traders Should Know About Using the Death Cross in Today’s Market
Modern trading environments present unique challenges for traditional technical analysis tools. High-frequency trading, algorithmic strategies, and quantitative funds have increased market efficiency, potentially reducing the effectiveness of widely known patterns.
Electronic trading platforms have made death cross identification more accessible to retail traders, but this democratization may have diminished the signal’s edge. Contemporary markets also exhibit different characteristics due to central bank interventions and coordinated global monetary policies that can override traditional technical signals.
Identifying trends in today’s market requires understanding these modern dynamics while maintaining respect for time-tested technical principles. The integration of artificial intelligence in trading has created new opportunities for analyzing death cross patterns alongside vast amounts of market data.
Next Steps for Traders Interested in Technical Analysis
Technical analysis encompasses numerous tools beyond the death cross pattern. Traders seeking comprehensive analytical skills should explore various investment strategies that incorporate multiple technical indicators and market analysis techniques.
Understanding the death cross provides a foundation for exploring more complex technical patterns and their applications in different market conditions. Trade desk stock forecasting demonstrates how technical analysis applies to specific investment opportunities.
If you’re ready to advance your technical analysis skills and access professional-grade tools and research, consider an Above the Green Line membership, which offers comprehensive resources designed to enhance your trading capabilities and market understanding.

Related Articles

Penny Stocks: How to Identify High-Probability Setups Using Rules-Based Investing

Margin Call Explained: What Triggers It and How to Avoid One

AMC Short Squeeze Explained: Timeline, Causes, and Trading Risks

Volatility Clustering in Financial Markets: Understand Why It Happens

[…] Reversal Strategy: Look for double tops, head and shoulders, or trendline breaks supported by reversal candlesticks like pin bars or engulfing patterns. This aligns with analysis of patterns, such as the death cross in stocks. […]