Above The Green Line

  • Commentary
    • BUY / SELL SIGNALS
      • Stock Alerts
    • DIVGRO BLOG
    • ETF SECTOR BLOG
    • DOW DOGS BLOG
    • NEWS
    • STOCK IDEAS
  • Strategies
    • SWING TRADING
      • CURRENT POSITIONS
      • WATCHLISTS
      • CLOSED POSITIONS
      • CANDIDATES – TOP 100
      • SPECIALTY STOCKS
    • DAY TRADING
      • Watch List
    • DIVIDEND GROWTH
      • Dividend Growth Portfolio
      • Dividend Calendar
    • DOGS OF THE DOW
      • Dogs of the Dow Portfolio
      • DOW 5 Portfolio
    • ETF SECTOR ROTATION
      • ETF Sector Portfolio
  • Markets
    • US MARKET
      • Commodities
      • Energy
      • Precious Metals
      • Volatility
    • GLOBAL MARKETS
      • MARKET INDICES
      • ECONOMIC CALENDAR
      • FOREX HEAT MAP
      • FOREX CROSS RATES
      • CRYPTOCURRENCY MARKET
    • DASHBOARD
    • IDEAS
  • Investing
    • FORUM
  • Resources
    • ARTICLES
    • WEEKLY STOCK
    • RETIREMENT PLANNING
    • BLOGROLL
    • FAQ
  • About
    • CONTACT US
    • HOW TO WIN
    • #1 AT STOCKCHARTS
  • Log In
  • Subscribe

August 6, 2016

Weekly Commentary – Markets are preparing for Higher Interest Rates!

08/06/2016 Weekly Commentary: Markets were up slightly for the week, and Closed strong on better economic news.  Now the Markets are preparing for Higher Interest Rates, as Bonds, Utilities and Real Estate all have weakened (Relative Strength has dropped Below 90).  The FED is running out of excuses the keep manipulating Short Term Interest Rates.

Long Bonds have gone Parabolic, which normally means the TOP, and also the BOTTOM of Interest Rates. Continued strength in Commodities will confirm that.

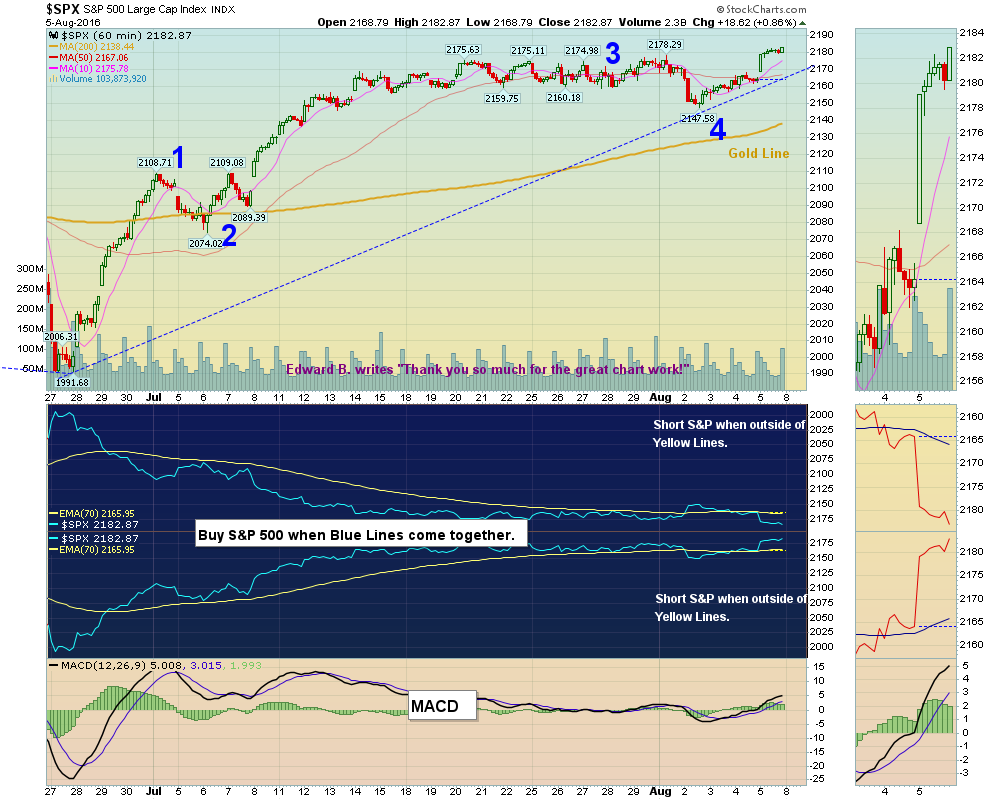
The S&P 500 was able to exceed Monday’s high, so it did not FAIL. This could be Wave 5 since the bounce off the Green Line in late June.  After Wave 5 is complete, the S&P 500 should drop down to test Support around 2130.

Current Open Positions  We have Closed out all but 2 positions. Most Leaders are in the Red Zones, Wait for Money Wave Buys coming out of the Green Zones. We will email you when they are ready.

When the Market breadth is narrow like it is now (few new highs), either take quick gains from Money Wave Pops, or STAY IN CASH & WAIT for a larger correction.

Many Funds are having trouble staying Above 90 Relative Strength. None of the major Indices have Above 90 Relative  Strength. Only ETFs of Metals GDXJ, GDX XME, SLV, Semis SMH, and a few Country Funds EWZ, & EWT have good Volume and Above 90 R S.

“Real Time” Charts for Today

S&P Elliott Wave Count.

Posted By AbovetheGreenLine at 12:27 pm 6 Comments

Comments

  1. tlek55@aol.com says

    August 7, 2016 at 7:57 am

    The S & P may be in wave 5, the MACD has crossed +, the blue chart shows the lines coming together, and the market did not fail. Should we be buying the S & P at this time ? Thank you so much for any insight. Tom

    Log in to Reply
  2. AbovetheGreenLine says

    August 7, 2016 at 10:53 am

    It is safer to Buy in Wave 1, not Wave 5 (which normally has less power & Volume).

    It is safer to Buy when the lines BEGIN to Narrow (like in late June), not when they are almost together.

    We like to Buy when the Money Wave on a Daily Chart is in the Green Zone… Most Investments currently are in or near the Red Zones.

    Thank you for your questions.

    Log in to Reply
  3. tlek55@aol.com says

    August 7, 2016 at 1:30 pm

    Great ! Thank You.

    Log in to Reply
  4. Randy24 says

    August 8, 2016 at 10:17 pm

    How can I duplicate your blue chart indicators?

    Log in to Reply
    • AbovetheGreenLine says

      August 9, 2016 at 3:11 pm

      I suppose you mean the Spread Indicator?

      Click on the center of the Chart to go to Settings.
      Under “Indicators” tab,
      select Price, then Parameters is -SPY, Position is Below
      Add another,
      select Price, then Parameters is SPY, Position is Below
      Make Blue Box for color…

      Thank you for Subscribing!

      Log in to Reply
      • Randy24 says

        August 10, 2016 at 8:15 pm

        Thank you

        Log in to Reply

Leave a Reply Cancel reply

You must be logged in to post a comment.

Voted #1 at Stock Charts

SH Chart
Inverse S&P 500 Fund (SH) will have a Money Wave Buy today.

Help Us Help Animals

Help Us Help Animals

Recent Comments

  • Green Line Weekly! Aug 7, 2022 – ParkRiver on Green Line Weekly! Aug 7, 2022
  • AbovetheGreenLine on Money Wave Alert! Aug 5, 2022
  • merryme on Money Wave Alert! Aug 5, 2022
  • AbovetheGreenLine on Target was Hit on CTIC for an 8.9% Gain.
  • SlippinJimmy on Target was Hit on CTIC for an 8.9% Gain.

Become a Green Liner!

Help me make more Money in the Stock Market.

Above the Green Line

ON ATGL

  • Weekly Commentary
  • Intraday Buy / Sells
  • Day Trade Setup

STRATEGIES

  • Swing Trading
  • Dividend Growth
  • ETF Sector Rotation
  • Dogs of the Dow

HELP

  • ATGL Trading Rules
  • FAQ
  • Account Maintenance
  • Contact US

© Copyright 2021 · AboveTheGreenLine.com · All Rights Reserved · Privacy · Terms · Contact · WatchList · Current