Above the Green Line -01
  • Market Insights
        • Commentary
          • Daily
          • Weekly
        • BUY / SELL SIGNALS
          • Trade Posts
          • Recent Trade Alerts
          • Recent Day Trades
        • BLOGROLL
          • Dividend Growth Blog
          • ETF Sector Blog
          • Dow Dogs
          • TPOW Blog
  • Strategies
        • SWING TRADING
          • Current Positions
          • Watchlists
          • Closed Positions
          • Candidates - TOP 100
          • Specialty Stocks
        • WEEKLY STOCK PICK
          • TPOW Charts
          • TPOW Performance
          • TPOW Strategy Guide
          • TPOW Performance Dashboard
        • DAY TRADING
          • Watch List
        • ATGL DASHBOARD
        • ETF STRATEGIES
          • ETF Sector Rotation
          • ETF Sector Portfolio
        • DIVIDEND GROWTH
          • Dividend Growth Portfolio
          • Dividend Calendar
        • DOGS OF THE DOW
          • Dogs of the Dow Portfolio
          • DOW 5 Portfolio
  • Markets
        • US MARKET
          • Commodities
          • Energy
          • Precious Metals
          • Volatility
        • GLOBAL MARKETS
          • Market Indices
          • Economic Calendar
          • FOREX Heat Map
          • FOREX Cross Rates
          • Crypto Currency Market
  • Investing
    • Discord Community
    • Dashboard
  • Resources
        • ARTICLES
          • Dividend Growth Model Articles
          • ETF Articles
          • Investment Strategies Articles
          • Market and Economic Insights
          • Stock Trade Articles
          • Stock Reviews
        • TOOLS
          • Stock Scanners
          • Charting Software
          • Brokerage Firms
        • STOCK CHARTS
          • Key Components
          • Reading Charts
          • Drawing Stock Charts
          • Identifying Trends
        • RETIREMENT PLANNING
  • About
    • Contact Us
    • How to Win
    • #1 At Stockcharts
    • Disclaimer
    • FAQ
  • Log In
  • Subscribe

January 2, 2017

Weekly Commentary Jan 2, 2017

Small Caps are Returning to Green Zone!


01/02/2017:  Markets were down about 1% for the  week, as the weaker Indices are finally dropping down towards their Red Lines (50-day averages)… which should create a nice Buying Trade back up.

Many of the Leading Funds are back down in the Green Zones, and we are waiting on Buy Signals (Money Wave Closing up > 20 and out of the Green Zone).

The Semiconductor and Financials are the 2 Strongest Sectors, which usually come down the least… They should re-test the recent highs soon.

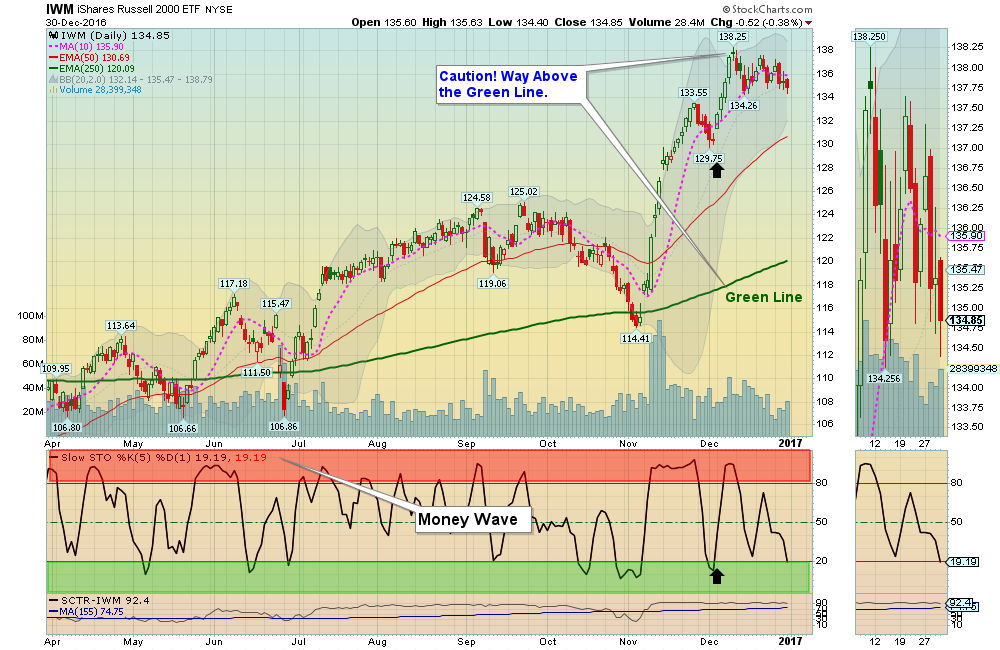
The US Dollar and Stock Markets are Way Above the Green Line. Bonds and Gold are Way Below the Green Line. Since all Investments RETURN to the Green Line, expect some weaker or negative news about Politics or the strength of the Economy early next year. We don’t use fundamental news for analysis, but many do… and are mystified by our forecasts. But we don’t predict. We let the Green Line “Tell Us”.

Please view the WATCH LIST  for pending Money Wave Buys.

Money Wave Buys Soon: AAL  AKS  AMAT  ECA  IWM  OIH  SMH  X & XLF    
Wait for Money Wave Buy Signals.  We will email you when they are ready.  

Click for  Open Positions   

Click for  Closed Positions

Alert! Market Risk HIGH (Yellow Zone). The probability of successful Short Term Trades is lower, when the S&P 500 is Way Above the Green Line. Even the Strongest Funds can get chopped up. Either take quick gains from Money Wave Pops, or STAY IN CASH & WAIT for a larger correction.

[s_static_display]

Tell your Friend about us, and HELP ANIMALS.

 
QUESTION: Mark G. writes “I’ve been following your trades for couple of months now and so far love the system. Some of your recent analysis had Reward/Risk criteria and I wonder if you have definition of poor Reward/Risk documented somewhere on the site.”

ANSWER:  Thank you for writing, Mark.
Reward / Risk should be at least 2:1 on every trade.  If you Buy an Investment at $12, for a re-test of Highs at $14, the Reward potential could be $2, or 16.7%. If you have a Stop at $11.5, you are risking $0.50.   So Reward / Risk is $2 / $0.50 =   4:1 odds… EXCELLENT!

We will add your Question to our FAQ Page.

Related Post

– Above the Green Line Dec 26, 2016

Subscribe to Our Newsletter

AGL Logo

Get our eBook Now!

Candlestick - A Swing Traders Friend

We don’t spam! Read our privacy policy for more info.

You’ve been successfully subscribed to our newsletter!

Voted #1 at Stock Charts

SH Chart
Inverse S&P 500 Fund (SH) will have a Money Wave Buy today.

Help Us Help Animals

Help Us Help Animals

Recent Comments

  • Market Breadth Indicators: A Trader’s Guide to Early Trend Detection on Backtesting: Definition and How a Trading Strategy Backtest Works
  • Island Reversal Pattern: Definition and Formation Explained on Double Top Pattern: How to Identify and Trade This Reversal Signal
  • Channel Pattern Guide: What It Is and Why It Matters on A Guide to Forecasting Using Moving Averages
  • What Is a Broadening Bottom Chart Pattern? Full Guide on Bull vs. Bear Market: An Investor’s Guide to Market Phases
  • ATGL Weekly Money Flow - 2025-05-11 on ATGL Top Pick of the Week! Apr 6, 2025

Become a Green Liner!

Help me make more Money in the Stock Market.

ON ATGL

  • DashBoard
  • Weekly Commentary
  • Daily Buy / Sell Signals
  • Day Trade Setup
  • Trading Rooms

Design & Develop By Pixelvect

STRATEGIES

  • Swing Trading
  • ATGL Pick of the Week
  • Dividend Growth
  • ETF Sector Rotation
  • Dogs of the Dow

HELP

  • ATGL Trading Rules
  • FAQ
  • Account Maintenance
  • Contact US
  • Join

FOLLOW US

Instagram Linkedin Twitter Facebook

© COPYRIGHT 2024 · ABOVETHEGREENLINE.COM · ALL RIGHTS RESERVED · PRIVACY · TERMS · CONTACT · WATCHLIST · CURRENT