Above The Green Line

  • Commentary
    • BUY / SELL SIGNALS
      • Stock Alerts
    • DIVGRO BLOG
    • ETF SECTOR BLOG
    • DOW DOGS BLOG
    • NEWS
    • STOCK IDEAS
  • Strategies
    • SWING TRADING
      • CURRENT POSITIONS
      • WATCHLISTS
      • CLOSED POSITIONS
      • CANDIDATES – TOP 100
      • SPECIALTY STOCKS
    • DAY TRADING
      • Watch List
    • DIVIDEND GROWTH
      • Dividend Growth Portfolio
      • Dividend Calendar
    • DOGS OF THE DOW
      • Dogs of the Dow Portfolio
      • DOW 5 Portfolio
    • ETF SECTOR ROTATION
      • ETF Sector Portfolio
  • Markets
    • US MARKET
      • Commodities
      • Energy
      • Precious Metals
      • Volatility
    • GLOBAL MARKETS
      • MARKET INDICES
      • ECONOMIC CALENDAR
      • FOREX HEAT MAP
      • FOREX CROSS RATES
      • CRYPTOCURRENCY MARKET
    • DASHBOARD
    • IDEAS
  • Investing
    • FORUM
  • Resources
    • ARTICLES
    • WEEKLY STOCK
    • RETIREMENT PLANNING
    • BLOGROLL
    • FAQ
  • About
    • CONTACT US
    • HOW TO WIN
    • #1 AT STOCKCHARTS
  • Log In
  • Subscribe

December 26, 2016

Above the Green Line Dec 26, 2016

The 4 Stages of any Investment


QUESTION from Dave:

“I have followed your site for some time.  My problem is my job (airline pilot) did not allow me to track daily closes and buy or sell on them due to the odd hours we work. Also, as this is a retirement account I have to play the long game and these pops and short term gains become too much of a job.  I see your long term trading concept, but cant understand how that applies as when the funds you list go to a buy, they would often lose money if you simply held the position off the buy signal until it crossed below the green line.

What am I missing?  How can I use your system with a long time horizon?

Thank you for your time and talent.  I’m happy to help and get the word out if you would like as I am all about making money and sharing info with my peers.

Cheers, Dave

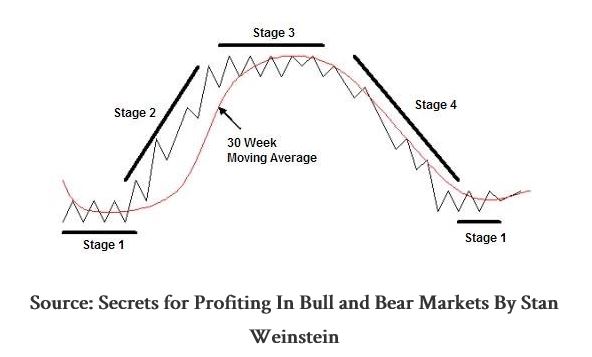
ANSWER:  Thank you for writing, Dave. We follow the Stage Chart Analysis of Stan Weinstein… And you should read his book Secrets For Profiting in Bull and Bear Markets for timeless Technical Analysis (digital copy only $1.99). At least read Chapter 2.

Most Stocks and Bonds are very High historically, and are well into Stage 2  (See Chart above) of an 8 year Bull in Stocks & (Bonds might be entering Stage 3 after 35 year unbelievable BULL). There should be some nice trades back up when the Leaders like NVDA finally correct down near the Green Line.

Commodities & Inverse Funds are In Stage 4 Decline (Steel & Coal already starting up) and could Double or Triple in the next BULL, based on History.

The HERD is in Stocks & Bonds, so Money will normally flow to where they ARE NOT.

While we are waiting for Inverse Funds and Commodities to begin Stage 2 UP, we are only doing Short Term Trading…

To expect Home Depot of Boeing to Double quickly from these levels is most likely ridiculous, based on current valuations.

Eventually, Markets will DUMP again, as INSIDERS are mostly SELLING now… And we should do very well in Inverse Funds, like we did in 2008, but we must wait until they MEET THE RULES.

Good trading, and tell your friends!

Posted By AbovetheGreenLine at 12:31 pm 2 Comments

Comments

  1. Chap says

    December 27, 2016 at 7:34 am

    Happy to hear you use Stan Weinstein techniques! That is a great book with a relatively easy strategy if followed. I too am an airline pilot with the same issues as Dave. Any advice on position sizing would be appreciated as well. I know that varies based on individuals. Thank you for your charts and Happy New Year.

    Scott

    Log in to Reply
    • AbovetheGreenLine says

      December 27, 2016 at 9:27 am

      Thank you Scott!

      This CHART has worked well, if you have the Discipline to WAIT for GREEN, and BUY then… Otherwise, go to CASH on rallies, unless you are very Bullish on Markets, and want to defy history.

      Possible current Stage Chart HERE.

      For size of Positions in your account, we suggest 5-8 Strong Stocks, and 3-5 ETF’s.
      Many preach Diversification (for those that don’t have, or FOLLOW RULES). We feel that Diversification reduces your performance, and suggest only Buy the LEADERS, but only if you STRICTLY FOLLOW THE RULES.

      Log in to Reply

Leave a Reply Cancel reply

You must be logged in to post a comment.

Voted #1 at Stock Charts

SH Chart
Inverse S&P 500 Fund (SH) will have a Money Wave Buy today.

Help Us Help Animals

Help Us Help Animals

Recent Comments

  • Money Wave Alert! Mar 27, 2023 – InvFuture Education on Money Wave Alert! Mar 27, 2023
  • Green Line Weekly! Mar 26, 2023 – InvFuture Education on Green Line Weekly! Mar 26, 2023
  • Green Line Weekly Mar 26, 2023 – InvFuture Education on Green Line Weekly Mar 26, 2023
  • AbovetheGreenLine on Money Wave Alert! Mar 22, 2023
  • Jesse Berry on Money Wave Alert! Mar 22, 2023

Become a Green Liner!

Help me make more Money in the Stock Market.

Above the Green Line

ON ATGL

  • Weekly Commentary
  • Intraday Buy / Sells
  • Day Trade Setup

STRATEGIES

  • Swing Trading
  • Dividend Growth
  • ETF Sector Rotation
  • Dogs of the Dow

HELP

  • ATGL Trading Rules
  • FAQ
  • Account Maintenance
  • Contact US

© Copyright 2021 · AboveTheGreenLine.com · All Rights Reserved · Privacy · Terms · Contact · WatchList · Current