Above The Green Line

  • Commentary
    • BUY / SELL SIGNALS
      • Stock Alerts
    • DIVGRO BLOG
    • ETF SECTOR BLOG
    • DOW DOGS BLOG
    • NEWS
    • STOCK IDEAS
  • Strategies
    • SWING TRADING
      • CURRENT POSITIONS
      • WATCHLISTS
      • CLOSED POSITIONS
      • CANDIDATES – TOP 100
      • SPECIALTY STOCKS
    • DAY TRADING
      • Watch List
    • DIVIDEND GROWTH
      • Dividend Growth Portfolio
      • Dividend Calendar
    • DOGS OF THE DOW
      • Dogs of the Dow Portfolio
      • DOW 5 Portfolio
    • ETF SECTOR ROTATION
      • ETF Sector Portfolio
  • Markets
    • US MARKET
      • Commodities
      • Energy
      • Precious Metals
      • Volatility
    • GLOBAL MARKETS
      • MARKET INDICES
      • ECONOMIC CALENDAR
      • FOREX HEAT MAP
      • FOREX CROSS RATES
      • CRYPTOCURRENCY MARKET
    • DASHBOARD
    • IDEAS
  • Investing
    • FORUM
  • Resources
    • ARTICLES
    • WEEKLY STOCK
    • RETIREMENT PLANNING
    • BLOGROLL
    • FAQ
  • About
    • CONTACT US
    • HOW TO WIN
    • #1 AT STOCKCHARTS
  • Log In
  • Subscribe

December 11, 2016

Weekly Commentary Dec 11, 2016

The Broad NYSE has not made Highs on Trump Rally!


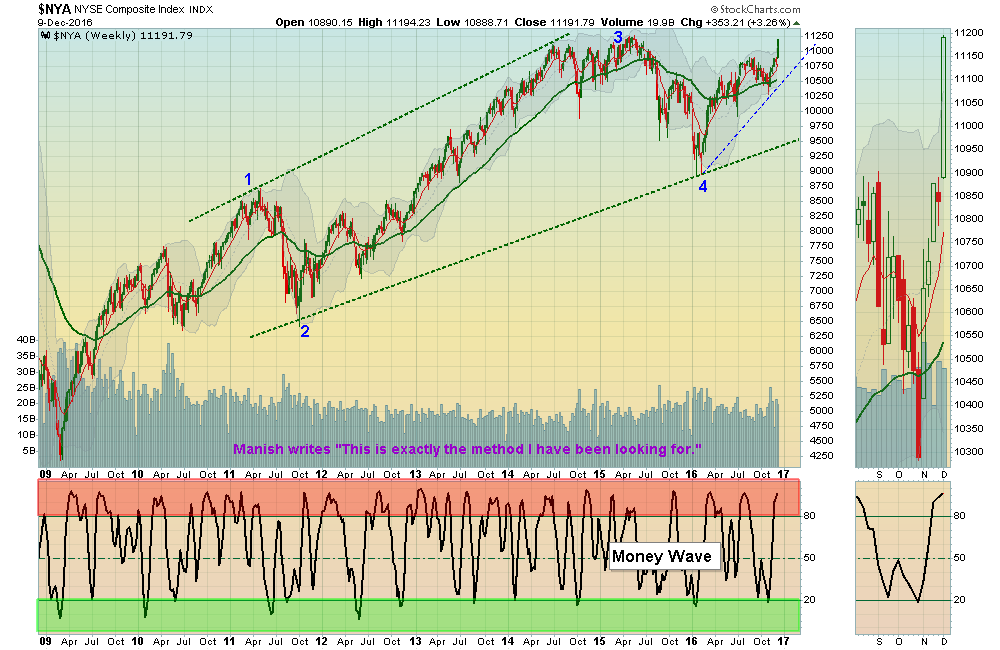
12/11/2016:  Markets squirted up 3% this week, right before the FED is probably going to RAISE Fed Funds Rate… Why is nobody talking about the FED? Most are Excited about the Trump Rally, and are hopeful many problems will be fixed.  What we KNOW is that the  S&P 500  and US Dollar are Way Above the Green Line.  

Bonds and Gold Miners are Way Below the Green Line. HOW DOES IT END? All will RETURN to the Green Lines… We just don’t know how far Investments will STRETCH from the Green Lines, before they snap back… The Stretching is temporary Human Emotion, which always fades over time. But Emotion give us Opportunities to Make Money.
The US Dollar is back up to the Highs, and might form a “Double Top” soon… If so, the Gold Miners might start up soon. There is FEAR in the Miners, as they have been correcting down 36% from the August highs. That is a lot, but remember, GDXJ had a run from $17 to $52 this year (205%), so a normal Wave 2 Correction is 38%. If the Elliott Wave count is correct, and GDXJ is going down on Wave 2, Wave 3 UP could go up to $91 from this low!  Wait for strength and Buy Signal.

Please view the Leader List Charts for pending Money Wave Buys & Open Positions.

Money Wave Buys Soon:  NONE.
Now is the time to RAISE CASH and WAIT for Money Waves Buys when they enter the Green Zones. We will email you when they are ready.  

Click for  Watch List   

Click for  Open Positions   

Click for Closed Positions

Alert! Market Risk HIGH (Red Zone). The probability of successful Short Term Trades is lower, when the S&P 500 is Way Above the Green Line. Even the Strongest Funds can get chopped up. Either take quick gains from Money Wave Pops, or STAY IN CASH & WAIT for a larger correction.

Tell your Friend about us, and HELP ANIMALS.

Posted By AbovetheGreenLine at 4:05 pm Leave a Comment

Leave a Reply Cancel reply

You must be logged in to post a comment.

Voted #1 at Stock Charts

SH Chart
Inverse S&P 500 Fund (SH) will have a Money Wave Buy today.

Help Us Help Animals

Help Us Help Animals

Recent Comments

  • Green Line Weekly! Aug 7, 2022 – ParkRiver on Green Line Weekly! Aug 7, 2022
  • AbovetheGreenLine on Money Wave Alert! Aug 5, 2022
  • merryme on Money Wave Alert! Aug 5, 2022
  • AbovetheGreenLine on Target was Hit on CTIC for an 8.9% Gain.
  • SlippinJimmy on Target was Hit on CTIC for an 8.9% Gain.

Become a Green Liner!

Help me make more Money in the Stock Market.

Above the Green Line

ON ATGL

  • Weekly Commentary
  • Intraday Buy / Sells
  • Day Trade Setup

STRATEGIES

  • Swing Trading
  • Dividend Growth
  • ETF Sector Rotation
  • Dogs of the Dow

HELP

  • ATGL Trading Rules
  • FAQ
  • Account Maintenance
  • Contact US

© Copyright 2021 · AboveTheGreenLine.com · All Rights Reserved · Privacy · Terms · Contact · WatchList · Current