
By ATGL
Updated June 5, 2025
Sharp reversals catch traders unprepared. These aggressive recoveries, driven by heavy volume and strong momentum, often signal institutional involvement. The V pattern chart is one of the clearest indicators of this institutional activity.
This article covers pattern recognition, volume confirmation, and strategic trade entries. You’ll learn to identify authentic V formations, distinguish them from false signals, and integrate momentum indicators to strengthen your decisions. We’ll explore optimal timeframes and examine how V patterns fit within broader investment strategies.
How To Spot the V Pattern Chart in Real Time Before the Breakout
The V pattern chart emerges in high-volatility environments where selling pressure exhausts itself rapidly. Watch for specific visual structures: a sharp decline followed by an equally aggressive recovery. The pattern forms when panic selling reaches a climax, creating oversold conditions that institutional buyers exploit.
Speed defines this formation. Unlike gradual trend reversals that develop over weeks, V patterns complete their cycle within days or hours. The symmetry between the decline and recovery creates the characteristic V shape that gives patterns in trading their distinctive appeal. Volume typically spikes during both phases, confirming the pattern’s validity.
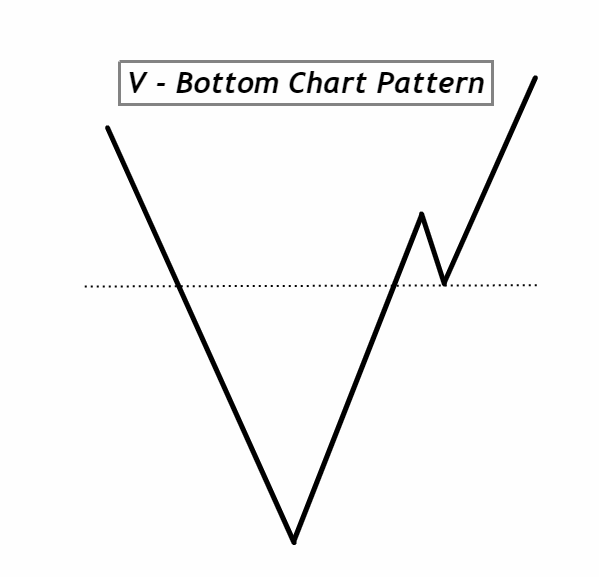
Breaking Down the Anatomy of the V Shape Chart Pattern
The V-shaped chart pattern consists of two distinct phases. The first phase involves a sharp selloff where prices decline rapidly on heavy volume. This selling pressure often stems from negative news, earnings disappointments, or broader market weakness, creating a sharp bearish trend that characterizes the first phase.
The second phase begins when selling exhausts itself. Buyers step in aggressively, creating an equally sharp recovery. This bounce occurs on volume that matches or exceeds the initial decline. Effective technical analysis requires recognizing that the decline and recovery should be roughly symmetrical, with volume confirming both moves.
How To Avoid False V Chart Pattern Signals: What Most Traders Miss
Many bounce setups mimic authentic V patterns but lack the substance needed for sustained moves. Weak volume represents the primary red flag. Authentic V chart pattern formations require heavy volume during both the decline and recovery phases.
Missing momentum signals provide another warning sign. What initially appears as a bearish pattern may actually be setting up for a V reversal if volume and momentum align properly. True V patterns show momentum indicators reaching oversold extremes during the decline, then reversing sharply during the recovery. False patterns often lack this momentum confirmation, resulting in weak bounces that fail to sustain themselves.
Key Signs a V Formation Chart Pattern May Fail
Several warning signs indicate that a V formation chart pattern may not hold. Declining volume during the recovery phase suggests weak buying interest. If the bounce occurs on a lighter volume than the initial decline, the pattern lacks conviction.
Momentum divergences also signal potential failures. When price makes new highs during the recovery but momentum indicators fail to confirm, the pattern may be losing steam.
The most effective timeframes for V pattern setups depend on your trading style. Day traders find success with five-minute and 15-minute charts, where V patterns can be completed within hours. Swing traders prefer daily charts, where patterns develop over several days. Weekly charts work for position traders seeking longer-term reversals.
Volume Clues During V Pattern Formation: What To Watch For
Volume analysis separates authentic V patterns from false signals. During the initial decline, volume should increase significantly as sellers panic. This heavy selling creates the oversold conditions necessary for the subsequent bounce.
The recovery phase requires equally impressive volume. Institutional buyers stepping in create large volume spikes that validate the reversal. This buying volume should match or exceed the selling volume from the decline phase. When volume during the bounce significantly exceeds recent averages, it confirms strong institutional interest.
Momentum Indicators That Strengthen V Chart Pattern Setups
Momentum indicators provide crucial confirmation for V pattern trades. The Relative Strength Index (RSI) often reaches oversold levels (below 30) during the decline phase and then crosses back above 30 as the recovery begins. This crossover provides an early signal that momentum is shifting.
MACD indicators offer another confirmation method. During authentic V patterns, the MACD line typically makes a bearish divergence during the decline, then crosses above the signal line as the recovery takes hold. Combining multiple technical indicators for trading increases confidence in the pattern’s validity.
RSI provides potential entry signals for V pattern trades. Enter long positions when RSI crosses above 30 after reaching oversold conditions. This crossover indicates the selling pressure is exhausting, and buying interest is emerging.
MACD offers more sophisticated timing opportunities. Watch for the MACD line to cross above the signal line while both remain below zero. This bullish crossover in negative territory often precedes the explosive moves that characterize V patterns.
Planning Your Entry and Exit on a V Shape Reversal
Entry timing proves critical for V pattern success. The optimal entry zone occurs during the early stages of the recovery, after volume confirms institutional buying but before the move becomes obvious to other traders. This window often lasts only hours or days, requiring quick decision-making.
Stop-loss placement should account for the pattern’s volatility. Set stops 5% to 10% below the pattern’s low, depending on the stock’s average true range. This provides enough room for normal volatility while protecting against pattern failure.
Target levels should reflect the pattern’s potential. Watch for price breaks above key resistance levels to confirm the reversal’s strength. Measure the distance from the pattern’s high to its low, then project this distance above the recovery point. This provides an initial profit target. For extended moves, consider the next significant resistance level, the previous peak, or the previous support that may act as resistance.
How To Integrate the V Pattern Into a Full Strategy
V patterns work best when integrated with broader market analysis. Sector strength analysis helps identify which areas of the market might produce the most reliable V formations. Stocks in strong sectors often experience more explosive recoveries than those in weak sectors.
News catalysts frequently trigger V patterns. Earnings disappointments, regulatory concerns, or broader market selloffs create the initial decline. Positive developments or oversold bounces then drive the recovery. Monitoring news flow helps anticipate potential V pattern opportunities.
The V pattern chart typically exhibits bullish characteristics once confirmed, establishing itself as a reliable bullish reversal pattern. The sharp recovery from oversold conditions often leads to continued upward movement as momentum builds. However, traders must distinguish between temporary bounces, trend continuations, and sustained reversals. Volume confirmation and momentum indicators help make this distinction.
Ready To Trade Clean Reversals With More Confidence?
Mastering V pattern recognition requires practice and discipline. These formations offer exceptional profit potential when identified correctly, but they demand quick execution and proper risk management. The combination of technical analysis, volume confirmation, and momentum indicators creates a powerful framework for trading these reversals.
Unlock institutional-grade V pattern signals and master high-probability reversals with an Above the Green Line membership. Above the Green Line’s trading system signals provide real-time alerts for V patterns and other powerful reversal formations. These signals combine institutional-grade analysis with user-friendly alerts, helping you capture clean reversals with greater confidence and consistency.

Related Articles

Stock Market Hours: The ONLY Trading Windows That Actually Matter (Most Traders Get This Wrong)

Penny Stocks: How to Identify High-Probability Setups Using Rules-Based Investing

Margin Call Explained: What Triggers It and How to Avoid One

AMC Short Squeeze Explained: Timeline, Causes, and Trading Risks
