
Ultimate Swing Trading Guide: Rules-Based Framework
Module 1: Foundations and Philosophy
The Ancestry of the Swing: From Dow to the Modern Era
To understand the swing, one must understand the origin of technical analysis itself. This guide presents swing trading through a rules-based trading framework rather than intuition or prediction. The philosophy we use today is built upon the shoulders of Charles Dow, the founder of the Wall Street Journal. Dow’s primary contribution to our craft was the realization that the market is not a chaotic mess, but a series of overlapping waves. He likened the market to the ocean: there are tides (long-term trends), waves (medium-term swings), and ripples (intraday noise).
By categorizing the market into these specific timeframes, we can clearly define the difference between Day Trading vs Swing Trading. While Day Trading focuses exclusively on the ‘Ripples’—trying to profit from price movements that occur within a single session—the swing trader seeks the higher-probability ‘Waves’ that develop over days or weeks.
Furthermore, when considering Scalping vs Swing Trading, the contrast becomes even more extreme. Scalping involves fighting for the tiniest ‘foam’ on the surface of those ripples, requiring hundreds of trades and intense screen time.
Ultimately, choosing the swing timeframe over these high-frequency styles allows for a rules-based trading system that filters out intraday noise, reduces transaction costs, and aligns your capital with the primary institutional ‘Tide.
In our rules-based framework, the primary ‘Tide’ is defined by the Green Line—the 250-day Simple Moving Average (SMA). This line represents the average price of a stock over a full trading year. We use the Green Line as our ultimate filter: if a stock is trading above a rising Green Line, the tide is in our favor. If it is below, we are simply spectators.
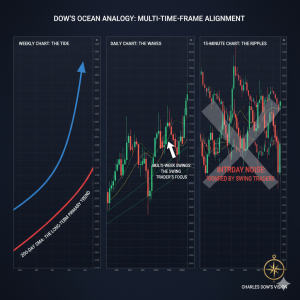
As illustrated in the Dow’s Ocean Analogy chart, professional success requires aligning your trades with the primary ‘Tide’ on the weekly timeframe while filtering out the chaotic ‘Ripples’ of intraday noise that often trap retail traders.
The modern swing trader is a specialist in the “wave.” While the tide determines the general direction of our bias, we are looking to catch the individual waves that move from the trough to the crest. This historical context is vital because it reminds us that the “patterns” we see on a screen today are the same patterns that existed in the 1920s. Why? Because while technology changes, human nature—the root of all price action—remains static. Fear and greed are hardcoded into the human genome, ensuring that the waves Dow observed a century ago will continue to manifest as long as humans are involved in the exchange of assets.
The Fractal Nature of Price: Why Scales Matter
One of the most profound realizations a trader can have is understanding that the market is fractal. A fractal is a mathematical set that exhibits a repeating pattern that displays at every scale. If you look at a coastline from a satellite, it has a certain jagged shape. If you stand on the beach and look at a ten-foot section of that same shore, it has the same jagged characteristics.
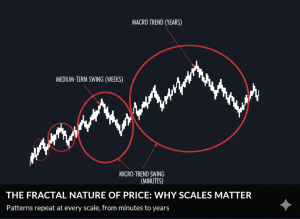
As demonstrated in the chart ‘The Fractal Nature of Price,’ the market exhibits self-similarity across all timeframes. Whether observing a micro-trend over minutes or a macro-trend over years, the underlying structure of human psychology remains constant, allowing the swing trader to apply the same technical logic regardless of the scale.
In trading, this means that a “swing” on a daily chart is actually a “trend” on a 15-minute chart. Conversely, a 10-year “trend” on a monthly chart is composed of hundreds of individual “swings.”
Understanding fractals allows the swing trader to achieve “Multi-Timeframe Alignment.” We look for a situation where the “tide” (the Weekly chart) is rising, and a “wave” (the Daily chart) is just beginning to turn upward. When these different scales align, we find the highest probability trades. This is often referred to as “trading in the direction of the higher timeframe,” and it is the closest thing to a “cheat code” in the professional trading world.
The Biological Barrier: Why Your Brain Wants You to Fail
We must address the elephant in the room: the human brain is biologically incentivized to be a terrible trader. Evolution has spent millions of years refining our “Fight or Flight” response. In the wild, if you heard a rustle in the grass, the humans who survived were the ones who ran away immediately. They didn’t wait for “confirmation” that it was a lion.
In the stock market, this instinct is a liability. When a stock price starts to drop, your amygdala—the lizard brain—screams at you to “run” (sell). Often, this happens exactly at the moment when a professional swing trader is looking to “buy the dip” at a support zone. Conversely, when a stock is skyrocketing, your brain releases dopamine, urging you to join the “tribe” and buy. This usually happens at the “Distribution” phase when the move is exhausted.
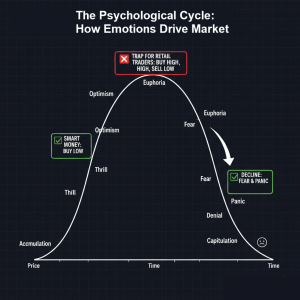
As shown in The Psychological Cycle diagram, the swing trader’s edge lies in identifying these emotional extremes; while the ‘Smart Money’ accumulates during periods of despondency, retail traders often fall into the trap of buying into euphoria and selling out of panic.”
To master Module 1, you must accept that you are entering a profession that requires you to act against your instincts. You must learn to:
- Buy into fear (when the setup dictates).
- Sell into greed (when the target is hit).
- Do nothing (when the market is in a “ripple” phase).
Mathematical Reality: Survival of the Disciplined
To master this guide, you must respect the statistics of the arena you are entering. Industry data consistently shows that 80% to 95% of active traders fail within their first two years. Why? Because they operate without a rules-based trading system, allowing their biological instincts to dictate their entries and exits.
Success in swing trading is governed by Mathematical Asymmetry. Most retail traders do not realize that a 50% loss requires a 100% gain just to get back to “break-even.” This is the “Death Spiral” of trading. By the time a trader realizes they are in trouble, the math is already working against their survival. This is why our philosophy prioritizes the preservation of capital above all else; if you lose your “seed corn,” you can no longer participate in the harvest.
Mathematical Reality: Survival of the Disciplined
To master this guide, you must respect the statistics of the arena you are entering.
Industry data consistently shows that 80% to 95% of active traders fail
within their first two years. Why? Because they operate without a rules-based trading system,
allowing their biological instincts to dictate their entries and exits.
Success in swing trading is governed by Mathematical Asymmetry. Most retail traders
do not realize that a 50% loss requires a 100% gain just to get back to “break-even.”
This is the “Death Spiral” of trading. By the time a trader realizes they are in trouble,
the math is already working against their survival. This is why our philosophy prioritizes
the preservation of capital above all else; if you lose your “seed corn,” you can no longer
participate in the harvest.
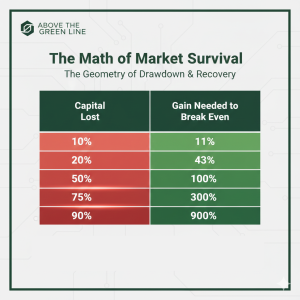
Figure 4 above illustrates the brutal arithmetic of capital recovery. As a trader moves deeper into drawdown, the gain required to return to ‘break-even’ increases exponentially. This mathematical reality is why our rules-based trading system prioritizes the 1% risk rule; by preventing significant losses, you avoid the ‘Death Spiral’ that claims 80% to 95% of active traders.
Defining Your Edge: The Logic of the Hunt
In the world of casinos, the “edge” is the 2.7% advantage the house has in Roulette because of the green “0” and “00” on the wheel. In swing trading, your edge is a specific set of circumstances that makes a price move in one direction more likely than the other.
An edge is not a magic formula; it is a structural anomaly identified through rules-based trading logic. For example, when a stock breaks out of a 6-month base (Stage 1 into Stage 2), the “edge” exists because thousands of short-sellers are forced to buy back their shares to cover their losses, while thousands of “breakout buyers” are jumping in simultaneously. This creates an imbalance of supply and demand that must result in a higher price.
While many market participants spend their time debating Growth vs Value Investing, the swing trader recognizes that our edge often lies in the intersection of both. Growth investors seek rapid expansion, while value investors hunt for undervalued bargains. In our rules-based framework, we seek high-growth ‘Stage 2’ leaders, but we wait for them to offer ‘value’ by pulling back to a high-probability support level. By identifying a growth stock at a value entry point, we capture explosive upside with disciplined risk management.
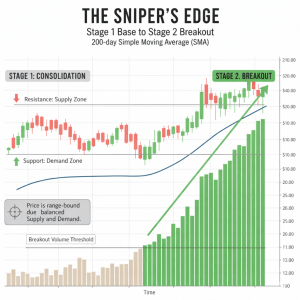
As illustrated in The Sniper’s Edge chart above, the transition from a Stage 1 consolidation into a Stage 2 breakout occurs when the balanced supply/demand dynamic is shattered by a surge in institutional buying, confirmed by a significant spike in relative volume.
Your job as a student of this guide is not to trade every ticker you see on social media. Your job is to wait, like a sniper, for your specific edge to appear. If your edge isn’t there, you don’t have a trade. You are not paid by the hour; you are paid by the quality of your decisions.
The Pillars of the Professional Routine
To bridge the gap between philosophy and the technical modules ahead, we must establish the “Professional Routine.” Most retail traders log into their accounts at 9:25 AM and start looking for something to buy. This is “reactive” trading, and it leads to ruin.
The professional swing trader is “proactive.” Their routine consists of three distinct phases:
- The Weekend Review: Scanning the entire market (or a curated universe of 500-1,000 stocks) to identify Stage 1 bases and Stage 2 leaders.
- The Nightly Maintenance: Checking the closing prices of held positions and adjusting stop-losses to protect capital.
- The Post-Trade Analysis: Reviewing losing trades to see if the mistake was in the execution (human error) or the probability (the edge just didn’t work this time).
By the time you finish this guide, these three phases will be as natural as breathing. You will no longer feel the need to watch the “ripples” during the day because you will have full confidence in the “waves” you identified the night before.
[CORE CONCEPT: THE DISCIPLINED EDGE]
Our rules-based trading system is designed to remove “gut feel” from the equation.
By defining exactly what constitutes a “Green Line” setup, we transform trading from
a guessing game into a repeatable process of probability.
Module 2: The Technical Arsenal
If the Foundations and Philosophy chapter provided the “why” of the market, this section provides the “how.” Technical tools serve as the backbone of a rules-based trading methodology by removing emotional guesswork. Technical analysis is often criticized by the uninitiated as “astrology for men,” but this misses the point entirely. We do not use charts to predict the future; we use them to identify the path of least resistance.
Price action is the only truly leading indicator. Everything else—news, earnings, even volume—is secondary to the actual movement of price. In this section, we will break down the technical tools that allow a swing trader to filter out the noise and find high-probability entry points discussed in our earlier deep dive on Probabilistic Thinking.
Mastering Price Action: The Language of Candles
Before you add a single line to your chart, you must understand the raw data. Candlestick charting is the most efficient way to visualize the battle between bulls and bears. A single candle tells a story of a specific timeframe, conveying the emotional and psychological aspects of market participants. Figure 5 below shows the Candlestick Anatomy.
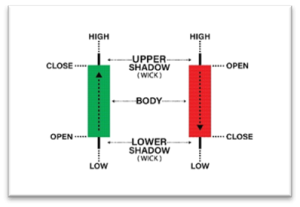
The “body” represents the range between the open and close prices, while the “wicks” (or shadows) represent the extreme price levels and volatility reached during that period. For a swing trader, the daily close is the most important data point, representing the final “vote” of the market participants after the “ripples” of intraday noise have settled. By learning to read both the body and the wicks together, traders gain insight not only into price movement, but also into the underlying psychology driving that movement.
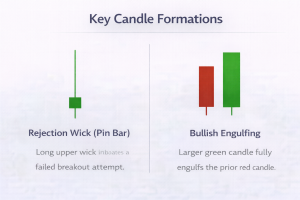
- The Rejection Wick: A long upper wick indicates that the market attempted to move higher but was met with overwhelming supply. In swing trading, this often signals that “Smart Money” is not yet ready for a breakout.
- The Engulfing Bar: This occurs when a candle’s body completely covers the previous candle’s body. A bullish engulfing bar after a pullback is a powerful reversal signal, indicating a total shift in sentiment from pessimism to buying pressure.
Resource Spotlight: For a comprehensive masterclass on identifying these formations, refer to my dedicated ebook, Candlestick – A Swing Trader’s Friend. It provides a deep dive into the 18th-century Japanese origins of this art and offers a complete “Candlestick Cheatsheet” for real-time trading.
The goal is to stop looking at candles as shapes and start looking at them as pressure gauges. When candles are small and overlapping, the market is in a “Doji” state of indecision. When they become large and close near their highs, the market is in a state of “momentum”.
The Moving Average Ribbon: Measuring the Trend’s Pulse
While there are hundreds of technical tools available, we focus on what we consider the best indicators for swing trading: moving averages. These act as the ‘heartbeat’ of our system, smoothing out price fluctuations to reveal the underlying trend and removing the noise that often leads to emotional decision-making.
The following diagram illustrates how the 10/20 EMA, 50 SMA, and 250 SMA work together as a visual “ribbon” that defines momentum, support, and long-term structure on a single chart.
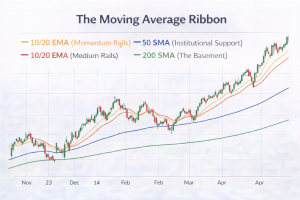
While many traders debate the merits of simple vs exponential moving averages, our framework utilizes a combination of both to identify where short-term momentum aligns with long-term trend strength.
In this guide, we focus on three specific timeframes:
The 10-Day and 20-Day Exponential Moving Averages (EMA)
These are our “Momentum Rails.” In a strong Stage 2 Markup (as defined in Market Cycles), a stock will often “ride” these EMAs without closing below them. We wait for pullbacks to these lines to “Buy the Dip” in its most mechanical form.
The 50-Day Simple Moving Average (SMA)
This is the “Institutional Line in the Sand.” Major funds often defend this level. When a stock pulls back to its 50-day SMA on low volume, it often signals that institutions are stepping in to support the trend.
The Green Line: 250-Day Simple Moving Average (SMA)
This is the “Basement.” As established in the Theory of Market Cycles, we rarely swing trade stocks trading below their 250-day SMA, as they are often in a Stage 4 Decline.
The 250-day SMA, or ‘The Green Line,’ is the foundation of our technical structure. While many retail traders look at the 200-day, we utilize the 250-day because it accounts for a complete year of market data, offering a ‘smoother’ and more institutional view of the long-term trend.
- Above the Green Line: The stock is in a healthy Stage 2 environment. We look for ‘Pullbacks to the Line’ as high-probability buying opportunities.
- Below the Green Line: The stock is ‘underwater.’ Regardless of how good the news sounds, price action below this line indicates institutional distribution. We do not buy here.
Volume: The Lie Detector of the Market
If price is the “what,” volume is the “who”. It confirms if a move is “real” or a “fake-out”. In swing trading, we look for Volume Contraction during pullbacks (showing selling has dried up) and Volume Expansion during breakouts (showing a surge of institutional interest).
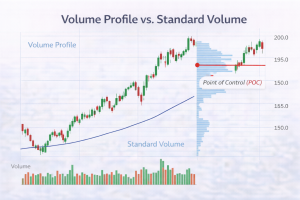
Volume Profile: Seeing Where the Big Money Lives
Standard volume bars tell you when trading happened; the Volume Profile tells you at what price it happened.
- Point of Control (POC): The price level where the most significant amount of “Smart Money” has transacted.
- High-Volume Nodes (HVN): These act as “gravity wells” or heavy support/resistance.
- Low-Volume Nodes (LVN): “Gas pockets” where price tends to move very quickly due to a lack of historical friction.
To see these differences visually, refer to the accompanying chart comparing standard vertical volume bars with the horizontal Volume Profile on the price axis. Notice how the Point of Control (POC) stands out as the price level with the greatest concentration of trading activity, while high- and low-volume nodes reveal areas of potential support, resistance, and rapid price movement.
Average True Range (ATR): The Volatility Ruler
The Average True Range (ATR) measures a stock’s natural “noise” or volatility. The professional swing trader uses the ATR to set “Volatility-Adjusted Stops.” Using a “2-ATR Stop” ensures you only exit if the trend actually changes, rather than being stopped out by normal daily fluctuations.
Relative Strength: Finding the “Alpha”
Relative Strength(RS) measures how a stock performs compared to the broader market. We prioritize stocks that refuse to fall during market corrections. These are like beach balls held underwater; once the market pressure subsides, they pop higher much faster than their peers, offering a clear Lifestyle Advantage.
Support and Resistance: The Geometry of Human Memory
Support and resistance are levels of human regret. Resistance is where trapped sellers wait to “get back to even,” while Support is where buyers who missed the last move wait for a “second chance”. A key concept is Polarity: once a resistance level is broken, it often becomes the new support “floor”.
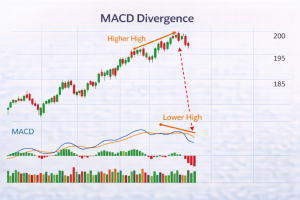
The Science of Trend Maturity: MACD
The MACD (Moving Average Convergence Divergence) measures the internal health of a swing. Its primary value is identifying Divergence:
- Bearish Divergence: Price makes a “Higher High” but the MACD makes a “Lower High,” signaling exhausted momentum.
- Bullish Divergence: Price makes a “Lower Low” but the MACD turns up, signaling a potential shift from a Stage 4 Decline back to accumulation.
This relationship becomes much clearer when viewed visually on a chart. In the accompanying example, notice how price continues to push to a higher high while the MACD line forms a lower high, revealing that momentum is weakening beneath the surface even as price appears strong. This visual separation between price action and indicator movement is the early warning signal that a trend may be nearing exhaustion. By learning to spot these divergences in real time, traders gain a powerful tool for anticipating reversals rather than reacting to them after the move has already occurred.
Scanning and Screening: Automating the Arsenal
To achieve the Lifestyle Advantage, you must use “Scanners” to distill 8,000+ stocks into a “Watchlist” of 10–15 high-probability candidates. A professional scan filters for:
- The Tide: Price > 250-day SMA.
- The Wave: Price > 20-day EMA.
- The Footprint: Relative Volume > 1.5.
- The Coil: Narrowing ATR before a breakout.
By automating this process, you ensure that you are only spending your time analyzing the highest-quality setups. This shift from manual searching to automated screening is what allows a trader to scale their results without scaling their hours. It transforms the “Technical Arsenal” from a set of static tools into a dynamic, profit-generating machine.
Module 3: High-Probability Setups
The Three Core Swing Trading Strategies
Before diving into specific chart patterns, it is vital to understand that professional execution relies on a rules-based trading framework. In this module, we break down the high-probability swing trading strategies used to exploit institutional money flow:
- The Failed Breakout Strategy (The “Squat”): Learning how to identify and exit “Bull Traps” before they turn into major losses.
- The Sector Rotation Strategy: A top-down approach to ensure you are trading the strongest stocks in the strongest sectors.
- The Low-Cheat Entry: An advanced strategy for entering trades early during a “Shakeout” to maximize your Risk-Reward Ratio.
While the 50-day SMA is the ‘Institutional Line in the Sand,’ the Green Line (250-day SMA) is the ultimate safety net. A high-probability ‘Low-Cheat’ entry is most powerful when it occurs just above a rising Green Line, as it indicates the stock has successfully tested its long-term support and is ready for a new leg higher
By mastering these three approaches, you move beyond simple pattern recognition and begin to trade in alignment with the underlying mechanics of institutional supply and demand.
The Anatomy of a Failed Breakout: The “Squat” and “Reversal”
One of the most valuable skills in swing trading is not just knowing when to buy, but knowing how to react when a high-probability pattern fails. Even the most perfect VCP or Bull Flag has a failure rate. In professional circles, a breakout that immediately loses momentum is known as a “Squat.”
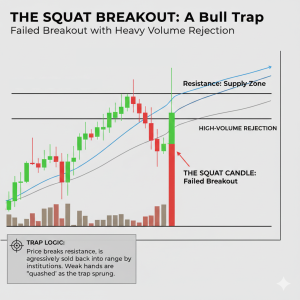
As demonstrated in The Squat Breakout chart above, this ‘Bull Trap’ occurs when price action decisively clears the resistance level on high volume, only to be met with overwhelming institutional supply that forces the candle to close back within the prior consolidation range.
When a stock breaks above a pivot point on high volume but then closes back inside its base or near the low of the daily range, the market is sending a warning signal. This usually occurs because there is still “hidden supply” or “overhead resistance” that the scanners didn’t catch. If you enter a trade and the stock “squats,” the professional move is not to hope for a recovery, but to tighten your stop-loss immediately or exit the position at break-even. Recognizing a failed setup early preserves your capital for the trades that actually work.
The “Failure-to-Follow-Through” rule states that if a stock breaks out, it should ideally stay above the breakout point for at least three consecutive days. If it drops back into the base with heavy volume, the “Smart Money” is likely using the breakout to sell their shares to the “Late Money.” Understanding this dynamic prevents you from becoming a “bag holder” in a trade that has lost its structural integrity.
Sector Rotation: Following the Invisible Hand
A high-probability setup does not exist in a vacuum. Its success rate is heavily influenced by the “Sector” it belongs to. In the stock market, money flows like water, moving from one sector to another based on interest rates, economic cycles, and institutional sentiment. This is known as Sector Rotation.
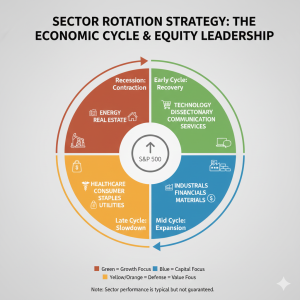
As illustrated in The Sector Rotation Wheel above, the probability of a Stage 2 breakout succeeding increases exponentially when the underlying sector is entering its ideal performance window within the economic cycle.
If you find a perfect Bull Flag in a technology stock, but the Technology Sector (XLK) is currently in a Stage 4 Decline, that trade has a much lower probability of success. Conversely, an average-looking setup in a “Hot Sector”—one that institutions are aggressively piling into—will often outperform the most “perfect” chart in a dead sector.
The professional swing trader monitors the 11 sectors of the S&P 500 to identify where the “Alpha” is currently residing. We look for Sector Convergence, where the individual stock, its industry group, and the broader sector are all breaking out simultaneously. When you have this triple-alignment, you are no longer swimming against the current; you are being carried by a tidal wave of institutional capital. This top-down approach ensures that you are always fishing in the most crowded ponds.
The “Shakeout” and “Low-Cheat” Entry
Many traders wait for the absolute top of a base to buy a breakout. However, the most profitable entries often happen inside the base. This is known as a “Low-Cheat” entry. It occurs after a “Shakeout”—a sudden, sharp drop in price designed to scare out weak-handed retail traders right before the real move begins.
The logic of the Shakeout is purely psychological. Institutions want to buy shares at the lowest possible price, so they may intentionally push a stock below a well-known support level to trigger retail stop-losses. Once those shares are surrendered, the stock quickly recovers. When you see a stock dip below its 50-day SMA and then immediately reclaim it on high volume, it is a sign that the supply has been “washed out.”
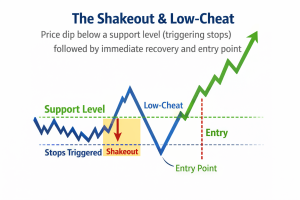
As illustrated in The Shakeout & Low-Cheat diagram above, the ‘Smart Money’ engineered dip below the support level serves to flush out weak-handed traders before an aggressive recovery provides a high-probability ‘Low-Cheat’ entry point well ahead of the final breakout.
A “Low-Cheat” entry involves buying the stock as it clears a mini-pivot within the larger base, rather than waiting for the final ATH breakout. This provides two massive advantages: it lowers your average cost, and it allows you to place a much tighter stop-loss, significantly improving your risk-to-reward ratio. This advanced tactic requires a mastery of the candlestick signals found in Candlestick – A Swing Trader’s Friend, as the “Hammer” or “Piercing Pattern” at the bottom of the shakeout is often your first hint that the trap has been set.
Trend Maturity and the “Blow-Off Top”
Just as we must identify the beginning of a swing, we must recognize its terminal phase. A setup that appears after a stock has already moved 100% higher in a few months is inherently more dangerous than a setup emerging from a fresh Stage 1 Accumulation base. This is the concept of Trend Maturity.
As a swing moves into its final stages, it often experiences a “Blow-Off Top.” This is characterized by price action that becomes vertical and “parabolic.” The daily ranges become massive, and the volume spikes to record levels. While this looks like the ultimate sign of strength, it is actually a sign of exhaustion. The last remaining buyers are rushing in due to “FOMO” (Fear Of Missing Out), while the institutions are using that liquidity to exit their massive positions.
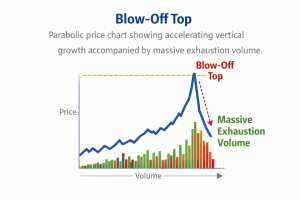
As illustrated in The Blow-Off Top chart above, the terminal phase of a trend is marked by a parabolic price curve and a massive spike in exhaustion volume, signaling that institutions are aggressively distributing their shares into the final retail buying frenzy.
The professional swing trader uses the technical tools from the Technical Arsenal, such as the RSI and the 10-day EMA, to spot these climax moves. When a stock is trading 20% or 30% above its 10-day EMA, the rubber band is stretched to its limit. In this environment, we stop looking for new setups and start focusing on “Trailing Stop Loss” to lock in the gains we’ve already made.
The Playbook Discipline: Quality Over Quantity
The ultimate secret of the high-probability playbook is the ability to do nothing. Most retail traders feel a compulsive need to have “skin in the game” at all times. They will lower their standards just to find a reason to click the “buy” button.
The professional operates like a high-stakes poker player. They are willing to “fold” 90% of the hands they are dealt, waiting patiently for the “Aces” (the perfect VCP or Blue Sky Breakout). When the market environment is choppy or declining, the best swing trading setup is often a “Cash Position.” By staying in cash during unfavorable conditions, you protect your “Mental Capital,” ensuring that you are sharp, focused, and well-funded when the next high-probability cycle begins.
Module 4: Risk Management and Position Sizing
The Golden Rule of 1%: Protecting the Core
Risk management is the operational core of any successful rules-based trading system. The foundation of professional risk management is the 1% Rule. This rule states that you should never risk more than 1% of your total account equity on any single trade. It is vital to distinguish between “Position Size” and “Risk.” If you have a $50,000 account, the 1% Rule means that if your trade hits its stop-loss, you lose exactly $500—not $50,000.
By limiting your risk to 1%, you insulate your account against the “Ruinous Streak.” Mathematically, you could lose ten trades in a row—a statistical anomaly for a disciplined trader—and still have 90% of your capital intact. This preservation of “Mental Capital” is just as important as the physical dollars; it allows you to place the eleventh trade with the same objective clarity as the first. Without the 1% Rule, a string of losses leads to emotional desperation, which invariably leads to larger, riskier bets in an attempt to “get back to even.”
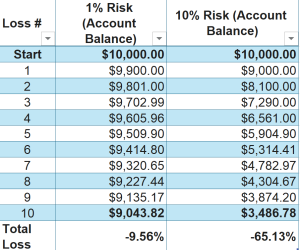
As demonstrated in Table 1: The 1% Rule Comparison, the mathematical difference between disciplined risk management and reckless over-leveraging is staggering; a string of ten losses at 1% risk leaves your capital nearly intact, while the same streak at 10% risk results in an irreversible 65% depletion of your account.
Calculating the Ideal Position Size
Once you have determined your dollar risk (e.g., $500), you must calculate exactly how many shares to buy. This is not a guess; it is a formula based on the distance between your Entry Price and your Stop-Loss Price.
The formula is: Shares = (Total Account Risk) / (Entry Price – Stop Price).
For example, if you are buying a stock at $100 and your technical analysis (using the ATR or support levels discussed in The Technical Arsenal) places your stop-loss at $95, your risk per share is $5. If your total account risk is $500, you would buy exactly 100 shares. This approach ensures that your risk remains constant regardless of whether you are trading a $10 stock or a $500 stock. It standardizes your losses, making your equity curve smoother and more predictable.
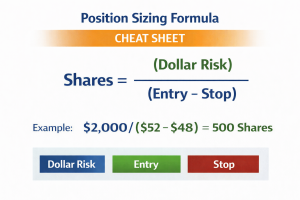
Figure 15 above illustrates a position-sizing cheat sheet that demonstrates how to calculate the number of shares to purchase by dividing the total dollar risk by the difference between the entry price and the stop-loss price.
The R-Multiple: The Unit of Performance
In professional trading, we do not measure gains in percentages or dollars; we measure them in R-Multiples. “R” stands for the initial risk you took on the trade. If you risked $500 to make $1,500, you have achieved a 3R return.
Viewing the market through the lens of R-Multiples shifts your focus from “being right” to “mathematical expectancy.” A trader who is right only 40% of the time but averages a 3R win and a 1R loss will be significantly more profitable than a trader who is right 70% of the time but lets their losses run to 2R or 3R. The goal of every setup in High-Probability Setups is to find entries that offer at least a 3:1 reward-to-risk ratio. As shown in The R-Multiple Matrix in Figure 15, this discipline ensures that a minority of winning trades can carry the weight of more frequent, smaller losses. This creates a “statistical cushion” that allows for the inevitable human errors and market “squats” that occur in real-world trading.
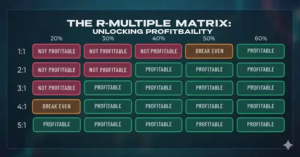
Understanding the distinction between Profitability vs Profit is what separates the professional from the amateur. While Profit refers to the dollar amount gained on a single successful trade, Profitability is the measurement of your system’s performance over a large sample size of trades. By focusing on high R-Multiple setups, you can maintain high overall profitability even if your win rate is below 50%. Our goal is not to ‘make a profit’ on every trade, but to execute a strategy that yields consistent profitability over the long term.
Stop-Loss Philosophy: Hard Stops vs. Mental Stops
There is a perennial debate among traders regarding “Hard Stops” (orders sitting on the exchange) versus “Mental Stops.” For the swing trader, the Hard Stop is almost always the superior choice. Because we operate on the End-of-Day (EOD) timeframe and are not watching every tick, a Hard Stop acts as your automated insurance policy against “Black Swan” events or sudden mid-day collapses.
A stop-loss should be placed at the point where the “trade thesis” is proven wrong. As we noted in our deep dive into Average True Range (ATR), your stop must be far enough away to breathe through normal volatility but close enough to maintain a favorable R-Multiple. If a stock breaks below the “Institutional Line in the Sand” (the 50-day SMA) or the bottom of a VCP contraction, the pattern is broken. Holding beyond this point is no longer trading; it is “hoping,” and hope is not a strategy.
Pyramiding: Scaling Into Strength
While risk management is often associated with limiting losses, it also involves maximizing winners. Pyramiding is the process of adding to a winning position as it moves in your favor. However, the professional never adds to a position in a way that increases the total account risk.
The “Safe Pyramid” technique involves waiting for the stock to move up and then moving your initial stop-loss to the break-even point. Only once the first “chunk” of the trade is “risk-free” do you add a second, smaller position. This allows you to control a larger amount of shares—potentially turning a 3R win into a 5R or 6R win—without ever risking more than the initial 1% of your account.
Portfolio Heat: Managing Total Correlation
Even if every individual trade follows the 1% Rule, you can still face catastrophic risk if all your trades move together. This is known as Portfolio Heat. If you have five different trades in the Semiconductor sector, you don’t have five 1% risks; you have one 5% risk on a single industry group.
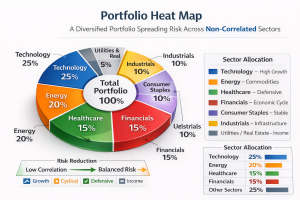
Figure 17 illustrates a diversified portfolio heat map where investment risk is distributed across non-correlated sectors such as Technology, Energy, and Healthcare to reduce overall volatility.
To manage Portfolio Heat, a swing trader must diversify across sectors. As discussed in the Sector Rotation analysis, money moves in cycles. By ensuring your “waves” are distributed across non-correlated areas—such as Tech, Energy, and Healthcare—you protect yourself against a sector-wide “flush.” A professional portfolio rarely has more than 20% to 25% “Total Heat” (total risk) at any given time. If the market becomes volatile, the first step is to reduce this heat by closing the laggards and moving to cash.
The Psychological Exit: Selling into Strength
The hardest part of risk management is not taking a loss, but knowing when to take a profit. Many traders let a 3R win turn back into a 1R loss because they became “married” to the stock. In the Technical Arsenal, we used the RSI and 10-day EMA to identify “overextended” stocks.
When a stock hits your price target or becomes parabolic (the Blow-Off Top), you must have a plan to exit. This is often done in thirds:
- Sell 1/3 at a 2R gain to “book” some profit and cover your initial risk.
- Sell 1/3 when the stock hits a major resistance level or price target.
- Hold 1/3 with a “Trailing Stop” (using the 20-day EMA) to capture any unexpected “home run” moves.
This tiered exit strategy balances the need for immediate profit with the desire to capture the full “Stage 2” markup. It ensures that even if the stock reverses sharply, you have extracted value from the move.
Module 5: The Lifecycle of a Trade
Mastering the philosophy and the technical setups is only half the battle. The other half is the cold, calculated execution of the trade lifecycle. A professional swing trader does not just “buy a stock”; they manage a process that begins long before the market opens and ends long after the trade is closed. This chapter breaks down that process into its functional phases, ensuring that nothing is left to chance or emotion.
The Watchlist Process: Filtering for Alpha
The lifecycle begins with the Weekend Scan. As we established in the Professional Routine, your goal is to distill thousands of tickers into a high-conviction watchlist of five to ten names. This is where you apply the criteria from The Technical Arsenal. You are looking for “Institutional Footprints”—stocks that are in a Stage 2 Markup, trading above a rising 200-day SMA, and showing tight price action.
A professional watchlist is categorized by “Priority.”
- Tier 1: Stocks that are within 1-2% of their pivot point and could break out tomorrow.
- Tier 2: Stocks that have the right structure but need another week of “resting” or volume contraction to be ready.
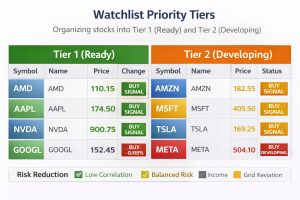
This figure demonstrates how a structured watchlist can be organized into priority tiers to help traders focus on the most actionable opportunities first.
By organizing your watchlist this way, you avoid the “Analysis Paralysis” that comes from looking at too many charts during market hours. You already know exactly what you are looking for; you are simply waiting for the market to trigger your entry.
The Entry Strategy: Precision Execution
When a stock on your Tier 1 list hits its “Pivot Point,” the execution phase begins. There are two primary ways to enter a swing trade, and your choice depends on your daily schedule and the volatility of the stock.
The Limit Order is the preferred tool for the swing trader. By placing a “Buy Stop Limit” order, you tell the broker: “Only buy this stock if it hits $100.00, but do not pay more than $100.10.” This protects you from “Slippage”—the hidden cost of buying a stock that is “gapping up” or moving too fast. It ensures you enter at the price your R-Multiple calculations were based on.
Conversely, some traders prefer the End-of-Day Entry. Instead of buying the intraday breakout, they wait until 3:55 PM EST to see if the stock is closing strong. This prevents you from being caught in a “Squat” (as discussed in The Playbook), where a stock breaks out in the morning only to fail by the afternoon. While you may pay a slightly higher price, the “confirmation” of the daily close significantly increases your win rate.
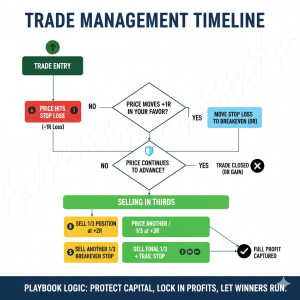
Trade Management: Navigating the “Middle”
Once you are in the trade, the hardest part begins: doing nothing. The first 48 hours of a swing trade are often the most volatile. This is the period where the “Shakeout” is most likely to occur. As long as the stock has not hit your Hard Stop, your job is to let the technical thesis play out.
The most critical adjustment during the trade lifecycle is the Move to Breakeven. Once a stock moves in your favor by a distance equal to your initial risk (a 1R gain), you should move your stop-loss to your entry price. This turns the trade into a “Free Look” at the market. You have effectively eliminated the downside risk, which provides the psychological peace needed to hold for the larger 3R or 5R targets.
Visualizing the process can help reinforce the decision sequence required during the middle phase of a trade – see Figure 18.
The Exit: Recognizing Climax and Exhaustion
Selling is far more difficult than buying because it requires you to fight against greed. A trade lifecycle ends in one of three ways:
- The Stop-Loss: The technical thesis failed, and you exited with a 1% account loss.
- The Price Target: The stock reached a historical resistance zone or a 3R/5R multiple, and you “sold into strength.”
- The Trend Break: The stock stayed in the trade for weeks but finally closed below its 10-day or 20-day EMA, signaling that the momentum has ended.
Professional traders often use the “Selling in Thirds” method. You sell the first third at a 2R gain to secure a profit, the second third at your primary price target, and let the final third “run” with a trailing stop. This ensures that you are rewarded for the move while still leaving the door open for a “Home Run” trade that exceeds your expectations.
The Post-Mortem: Building Your Internal Database
The trade is not “over” once the shares are sold. The final phase of the lifecycle is the Post-Trade Analysis. Every trade—win, loss, or scratch—must be logged in a journal. You must record the entry reason, the emotions you felt during the hold, and the reason for the exit.
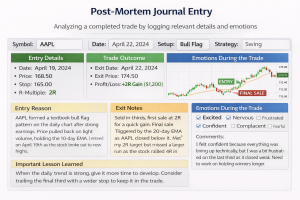
By maintaining a Post-Mortem Journal Entry, as shown in Figure 20, you transform a single transaction into a business asset, capturing not only the cold hard data of the trade but also the critical psychological variables that influenced your decision-making.
Over time, this journal becomes your most valuable asset. It will reveal patterns in your behavior. Perhaps you discover that you have an 80% win rate on Bull Flags but a 20% win rate on Mean Reversion trades. This data allows you to “fire” the setups that don’t work for you and double down on the ones that do. This is how a retail trader evolves into a professional operator: by treating every trade as a data point in a lifelong business.
Module 6: Fundamental Catalysts
While the Technical Arsenal tells us when to buy, Fundamental Catalysts tell us why a stock is moving. In swing trading, we are not looking for “value” in the traditional sense (like Warren Buffett); we are looking for Fuel. Fundamentals act as the accelerant that makes technical patterns explode.
The Power of Earnings: The Ultimate Catalyst
Earnings reports are the primary movers of the stock market. For a swing trader, an earnings “beat” is not just about the numbers; it is about the Institutional Reaction. If a company reports great earnings and the stock gaps up on massive volume, it is a sign that big funds are “re-rating” the stock.
The Post-Earnings Drift is a well-documented phenomenon where a stock continues to trend in the direction of its earnings surprise for weeks or even months. We look for a “High Tight Flag” or a “VCP” to form after the earnings report. This combines the fundamental power of the news with the technical precision of our playbook.
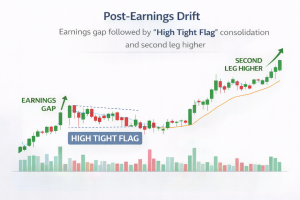
Figure 21 illustrates a classic post-earnings drift pattern in which strong earnings momentum leads to a sustained continuation move rather than an immediate reversal.
The “New” Factor: Innovation and Change
Stocks that make the largest “swings” are almost always associated with some form of Change. This could be a new product (like the iPhone for Apple), a new management team, or a new industry tailwind (like AI or Green Energy).
When a company introduces a revolutionary product, it creates a “Blue Sky” environment of growth. As a swing trader, you should always be aware of the “Narrative” behind the numbers. A stock with a perfect chart AND a compelling story of innovation is far more likely to produce a “Home Run” trade than a stock with no story at all.
Relative Strength vs. The Market Tide
Fundamentals also include the “Macro” environment. We must look at the Sector Strength (as discussed in Sector Rotation). Even a company with great earnings will struggle if its entire sector is being sold off due to interest rate hikes or geopolitical tension.
We use Relative Strength as our fundamental filter. If the S&P 500 is down 2% but a stock is UP 1%, that is the ultimate fundamental “tell.” It means the demand for that stock is so overwhelming that it is ignoring the market’s gravity. These are the stocks we want to own.
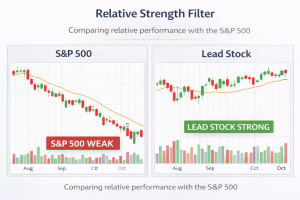
As demonstrated in the Relative Strength Filter, true market leaders reveal themselves when the S&P 500 is in a downtrend; while the broader index creates lower lows, the ‘Lead Stock’ maintains its structure by trending sideways or even higher, signaling massive institutional accumulationModule 7: The Psychological Edge
Module 7: The Psychological Edge
Trading is 10% strategy and 90% psychology. As we explored in the Foundations and Philosophy chapter, your brain is naturally wired to seek comfort and avoid pain. In the market, “comfort” usually means buying when everyone else is buying (at the top) and “avoiding pain” means selling when a stock pulls back (at the bottom). To succeed, you must develop a “Third-Person Perspective” on your own emotions.
The Cycle of Trader Emotions
Every swing trader goes through a predictable emotional arc during a trade. It begins with Optimism upon entry, moves toward Euphoria as the stock hits a 2R gain, and then quickly shifts to Anxiety and Denial when the stock begins to pull back.
The amateur trader is a slave to this cycle. They make decisions based on how they feel in the moment. The professional, however, recognizes these emotions as “bio-feedback” but does not let them touch the keyboard. By understanding that euphoria is often a sign of a Blow-Off Top and that fear is often a sign of a Shakeout, you can use your own emotions as a contrarian indicator.
The “Probabilistic Mindset”: Moving Beyond Right and Wrong
The greatest psychological hurdle for a new trader is the need to be “right.” In most professions—medicine, law, engineering—being right 90% of the time is the standard. In swing trading, you can be “wrong” 60% of the time and still make a fortune, provided your winners are significantly larger than your losers.
Adopting a Probabilistic Mindset means accepting that any single trade is essentially a coin flip with a weighted edge. A probabilistic mindset allows traders to trust their rules-based trading framework even when emotions suggest otherwise. If you take a loss, it doesn’t mean you are a “bad trader” or that your system is broken; it simply means that the “tails” side of the coin came up this time. When you stop attaching your ego to the outcome of a single trade, the stress of trading evaporates. You no longer fear the stop-loss; you view it as the “cost of doing business,” much like a restaurant owner views the cost of electricity.
The Danger of “Revenge Trading”
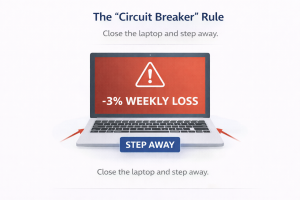
When a trader suffers a significant loss—especially one where they broke their own rules—the immediate impulse is to “get it back.” This is Revenge Trading. It is a state of temporary insanity where the trader increases their position size and lowers their entry standards in a desperate attempt to repair their account balance.
Revenge trading is the primary cause of account blowouts. To combat this, you must implement a “Circuit Breaker.” For example, if you lose 3% of your total account equity in a single week, you must force yourself to step away from the screens for 48 hours. This allows the “Lizard Brain” (the amygdala) to cool down and the rational “Trader Brain” to regain control.
The following visual represents the practical application of a personal trading “circuit breaker” designed to protect both capital and mental clarity.
Developing Patience: The Art of Sitting on Your Hands
In the Pillars of the Professional Routine, we discussed the importance of being proactive rather than reactive. The hardest part of this routine is the “waiting room.” There will be weeks when the market is in a Stage 4 Decline and no high-probability setups are appearing.
During these times, the “itch” to trade becomes overwhelming. Amateurs will manufacture “B-minus” setups just to feel active. The professional understands that Cash is a Position. Staying in cash during a bad market is not “missing out”; it is a strategic decision to protect your capital for the “A-plus” setups that will inevitably return. Mastery of the swing is as much about the trades you don’t take as the ones you do.
The Trading Journal as a Mirror
We will discuss the technical side of journaling in the Tools & Resources module, but the psychological benefit of a journal is even greater. By recording your thoughts at the moment of entry and exit, you create a “mirror” for your mind.
Six months from now, you can look back and see that you consistently felt “nervous” during your best-performing trades and “confident” during your biggest losers. This insight is priceless. It teaches you that “feeling good” is often a sign of danger in the market, while “feeling slightly uncomfortable” is often the hallmark of a professional entry.
Module 8: Tools, Resources, and the Trading Environment
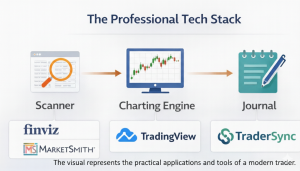
A master craftsman is only as good as their tools. While it is true that a poor trader can lose money with the best software, a professional trader uses technology to gain a split-second advantage in data processing and execution. In this final module, we detail the essential “Tech Stack” and environmental habits required to run your swing trading business with institutional efficiency.
As demonstrated in the Professional Tech Stack diagram below, a disciplined workflow relies on the seamless integration of discovery, analysis, and post-trade reflection to maintain a consistent edge in the markets.
The Charting Engine: Your Window to the Market
The most important tool in your arsenal is your charting platform. For a swing trader, you do not need the hyper-fast, complex “Level 2” data required by day traders, but you do need “Clean Data” and robust technical indicators.
Platforms like TradingView, TC2000, or StockCharts are the industry standards. Earlier in this guide, we identified the best indicators for swing trading. Now, you must configure your engine to allow you to save multiple layouts—one for the Weekend Review where you view the “Tide” (Weekly charts), and one for the Nightly Maintenance where you manage the “Waves” (Daily charts).
Efficiency here is key. You should master keyboard shortcuts to cycle through your watchlist. If it takes you 30 seconds to analyze a chart, you can review 100 stocks in 50 minutes. If it takes you 3 minutes, your routine becomes a grueling chore that you will eventually abandon.
The Scanning Software: Finding the Needle in the Haystack
As we discussed in The Technical Arsenal, you cannot manually hunt through 8,000 stocks. You need a powerful “Screening Engine.” A professional scanner should be able to cross-reference technical and fundamental data simultaneously.
For example, your primary scan should look for:
- Technicals: Price above the 250-day SMA and within 5% of a 52-week high.
- Fundamentals: Quarterly earnings growth > 20% (as detailed in Fundamental Catalysts).
- Volume: Relative volume > 1.2.
Tools like MarketSmith or Finviz Elite are exceptional for this. They allow you to “stack” filters so that only the highest-quality setups—those that meet the criteria of your Playbook—ever make it to your screen.
The Trade Journal: Your Personal Algorithm
Your most valuable resource is not a website or a news feed; it is your own history. A digital trade journal like TraderSync or Edgewonk is mandatory. These tools automatically import your trades from your broker and provide you with a “Statistical Fingerprint.”
The journal will tell you your Profit Factor, your Average Hold Time, and your Expectancy per Setup. If the data shows that your “Bull Flag” trades are making money while your “Mean Reversion” trades are losing, you have the empirical evidence to stop trading reversals. This is how you “fire your boss” and become your own manager—by letting the data dictate your strategy.
Information Hygiene: Avoiding the Noise
In the age of social media, the greatest threat to a swing trader is “Information Overload.” To protect your Psychological Edge, you must practice strict information hygiene.
- Turn off Financial News: Real-time news is designed for day traders and “noise” players. For a swing trader, the news is already baked into the price by the time you hear it.
- Curate Your Social Media: If you follow 500 “gurus,” you will hear 500 different opinions. Follow only a handful of traders who share your philosophy of Stage 2 markups and risk management.
- The “One Source” Rule: Pick one primary source for your fundamental data and one for your technicals. Redundancy leads to hesitation.
The Physical Trading Environment
Finally, we must address the space where you work. Swing trading is a business of “Quiet Concentration.” Your physical environment should reflect that.
- Ergonomics: Since you will spend hours on the weekends performing the Weekend Review, invest in a high-quality chair and a monitor setup that prevents eye strain.
- Routine Triggers: Have a specific ritual that starts your trading session—perhaps a specific cup of coffee or a clean desk. This tells your brain it is time to shift from “Consumer” to “Operator.”
- The “Kill Switch”: Have a plan for when your internet goes down or your power fails. Keep your broker’s “Order Desk” phone number saved in your contacts. Being unable to close a position during a market “Squat” because of a tech failure is a preventable disaster.
Final Action Plan: Your Path to Mastery
You have now traveled through the entire landscape of professional swing trading:
- Foundations: Understanding the “Waves” and the “Fractal” nature of price.
- Technical Arsenal: Mastering candles, volume, and moving averages (including your deep-dive resource, Candlestick – A Swing Trader’s Friend).
- The Playbook: Identifying VCPs, Bull Flags, and Blue Sky Breakouts.
- Risk Management: Implementing the 1% Rule and R-Multiples.
- The Lifecycle: Executing entries and exits with precision.
- Fundamentals: Using earnings and innovation as fuel.
- The Mindset: Overcoming the biological barriers to success.
- The Tools: Building an environment for professional execution.
The transition from a retail “gambler” to a professional “swing trader” does not happen overnight. It happens through consistent application of these modules within a rules-based trading discipline. Start small, track every data point, and remember: the market does not reward the smartest person; it rewards the most disciplined.
Conclusion: The Lifestyle Advantage
“Mastering swing trading is not about predicting the future; it is about managing the present. By utilizing a rules-based trading system, aligning with the Green Line, and respecting the mathematical asymmetry of risk, you move from being a ‘gambler’ in the ripples to a ‘professional’ in the waves.
This is the path to the Lifestyle Advantage—where your money works for you, rather than you working for your money. You no longer need to be chained to a desk during market hours because your routines handle the heavy lifting.
Your Next Step: Now that you understand the philosophy and tools, it is time to see them in action. Join our community to see how we apply these rules in today’s market.”