Above the Green Line -01
  • Market Insights
        • Commentary
          • Daily
          • Weekly
        • BUY / SELL SIGNALS
          • Trade Posts
          • Recent Trade Alerts
          • Recent Day Trades
        • BLOGROLL
          • Dividend Growth Blog
          • ETF Sector Blog
          • Dow Dogs
          • TPOW Blog
  • Strategies
        • SWING TRADING
          • Current Positions
          • Watchlists
          • Closed Positions
          • Candidates - TOP 100
          • Specialty Stocks
        • WEEKLY STOCK PICK
          • TPOW Charts
          • TPOW Performance
          • TPOW Strategy Guide
          • TPOW Performance Dashboard
          • Why Weekly Trading Works
        • DAY TRADING
          • Watch List
        • ATGL DASHBOARD
        • ETF STRATEGIES
          • ETF Sector Rotation
          • ETF Sector Portfolio
        • DIVIDEND GROWTH
          • Dividend Growth Portfolio
          • Dividend Calendar
        • DOGS OF THE DOW
          • Dogs of the Dow Portfolio
          • DOW 5 Portfolio
  • Markets
        • US MARKET
          • Commodities
          • Energy
          • Precious Metals
          • Volatility
        • GLOBAL MARKETS
          • Market Indices
          • Economic Calendar
          • FOREX Heat Map
          • FOREX Cross Rates
          • Crypto Currency Market
  • Investing
    • Discord Community
    • Dashboard
  • Resources
        • INVESTING GUIDES
          • Dividend Growth Guide
          • Investment Strategy Framework
          • ETF Investing Handbook
          • Stock Trading Handbook
        • ARTICLES
          • Dividend Growth Model Articles
          • ETF Articles
          • Investment Strategies Articles
          • Market and Economic Insights
          • Stock Trade Articles
          • Stock Reviews
        • TOOLS
          • Stock Scanners
          • Charting Software
          • Brokerage Firms
          • Stocks We Review
        • STOCK CHARTS
          • Key Components
          • Reading Charts
          • Drawing Stock Charts
          • Identifying Trends
  • About
    • Contact Us
    • How to Win
    • #1 At Stockcharts
    • Disclaimer
    • FAQ
  • Log In
  • Subscribe

Trade Signals

Above the Green Line presents both daily and weekly posts to its members highlighting Investment News and Trade alerts.

April 22, 2019

Money Wave Alert! Apr 22, 2019

QQQ Chart

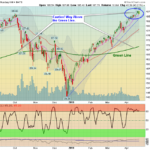
  Markets were mixed today, on a small range day.  The S&P 500 Index is drifting sideways, but has been holding above the Pink Line of 2898 to avoid a Short Term Sell Signal. Please WAIT for the Leaders to return back down to their … [Read more...]

April 18, 2019

Money Wave Alert! Apr 18, 2019

IWM Chart

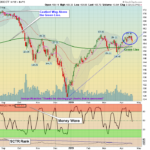
  MARKETS WILL BE CLOSED ON FRIDAY APRIL 19th to CELEBRATE GOOD FRIDAY. Markets were up today, on lower pre-holiday Buying.  The S&P 500 Index dipped below the Pink Line of 2896 this morning, but bounced up to avoid a Short Term Sell … [Read more...]

April 17, 2019

Money Wave Alert! Apr 17, 2019

MRK Chart

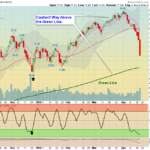
  Markets were down slightly today, as the Health Care Stocks were under pressure.  The S&P 500 Index needs to stay  above the Pink Line of 2894 to avoid a Short Term Sell Signal. Please WAIT for the Leaders to return back down to … [Read more...]

April 16, 2019

Money Wave Alert! Apr 16, 2019

TLT Chart

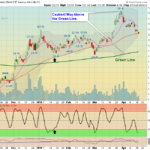
  Markets "Gapped Up" on the opening and then faded later on.  The S&P 500 Index is over-bought and needs to stay  above the Pink Line of 2891 to avoid a Short Term Sell Signal. Please WAIT for the Leaders to return back down to their … [Read more...]

April 15, 2019

Money Wave Alert! Apr 15, 2019

SPX 60-min

  Markets were down slightly today, but recovered from the Lows this morning. The Volume was low again.  The S&P 500 Index needs to stay  above the Pink Line of 2888 to avoid a Short Term Sell Signal. Please WAIT for the Leaders to … [Read more...]

  • « Previous Page
  • 1
  • …
  • 359
  • 360
  • 361
  • 362
  • 363
  • …
  • 495
  • Next Page »

Subscribe to Our Newsletter

AGL Logo

Get our eBook Now!

Candlestick - A Swing Traders Friend

We don’t spam! Read our privacy policy for more info.

You’ve been successfully subscribed to our newsletter!

Voted #1 at Stock Charts

SH Chart
Inverse S&P 500 Fund (SH) will have a Money Wave Buy today.

Help Us Help Animals

Help Us Help Animals

Recent Comments

  • DBC ETF Guide: Is This Commodity Fund Worth the Risk? on ETF Asset Allocation: Choosing the Right Mix for Your Portfolio
  • ATGL Weekly Money Flow - 2026-03-08 on ATGL Top Pick of the Week! Feb 22, 2026
  • XBI ETF Explained: Is This Biotech Fund a Smart Buy in 2026? on What Is an Expense Ratio and What Would Be a Good One?
  • XBI ETF Explained: Is This Biotech Fund a Smart Buy in 2026? on What Are Sector ETFs and How Do You Invest in Them?
  • XBI ETF Explained: Is This Biotech Fund a Smart Buy in 2026? on ETF vs Index Fund Comparison Guide for Smarter Investing

Become a Green Liner!

Help me make more Money in the Stock Market.

ON ATGL

  • DashBoard
  • Weekly Commentary
  • Daily Buy / Sell Signals
  • Day Trade Setup
  • Trading Rooms

Design & Develop By Pixelvect

STRATEGIES

  • Swing Trading
  • ATGL Pick of the Week
  • Dividend Growth
  • ETF Sector Rotation
  • Dogs of the Dow

HELP

  • ATGL Trading Rules
  • FAQ
  • Account Maintenance
  • Contact US
  • Join

FOLLOW US

Instagram Linkedin Twitter Facebook

© COPYRIGHT 2024 · ABOVETHEGREENLINE.COM · ALL RIGHTS RESERVED · PRIVACY · TERMS · CONTACT · WATCHLIST · CURRENT